29
/
en
AIzaSyAYiBZKx7MnpbEhh9jyipgxe19OcubqV5w
April 1, 2024
112519
Costa Rica
CRI
true
2
1
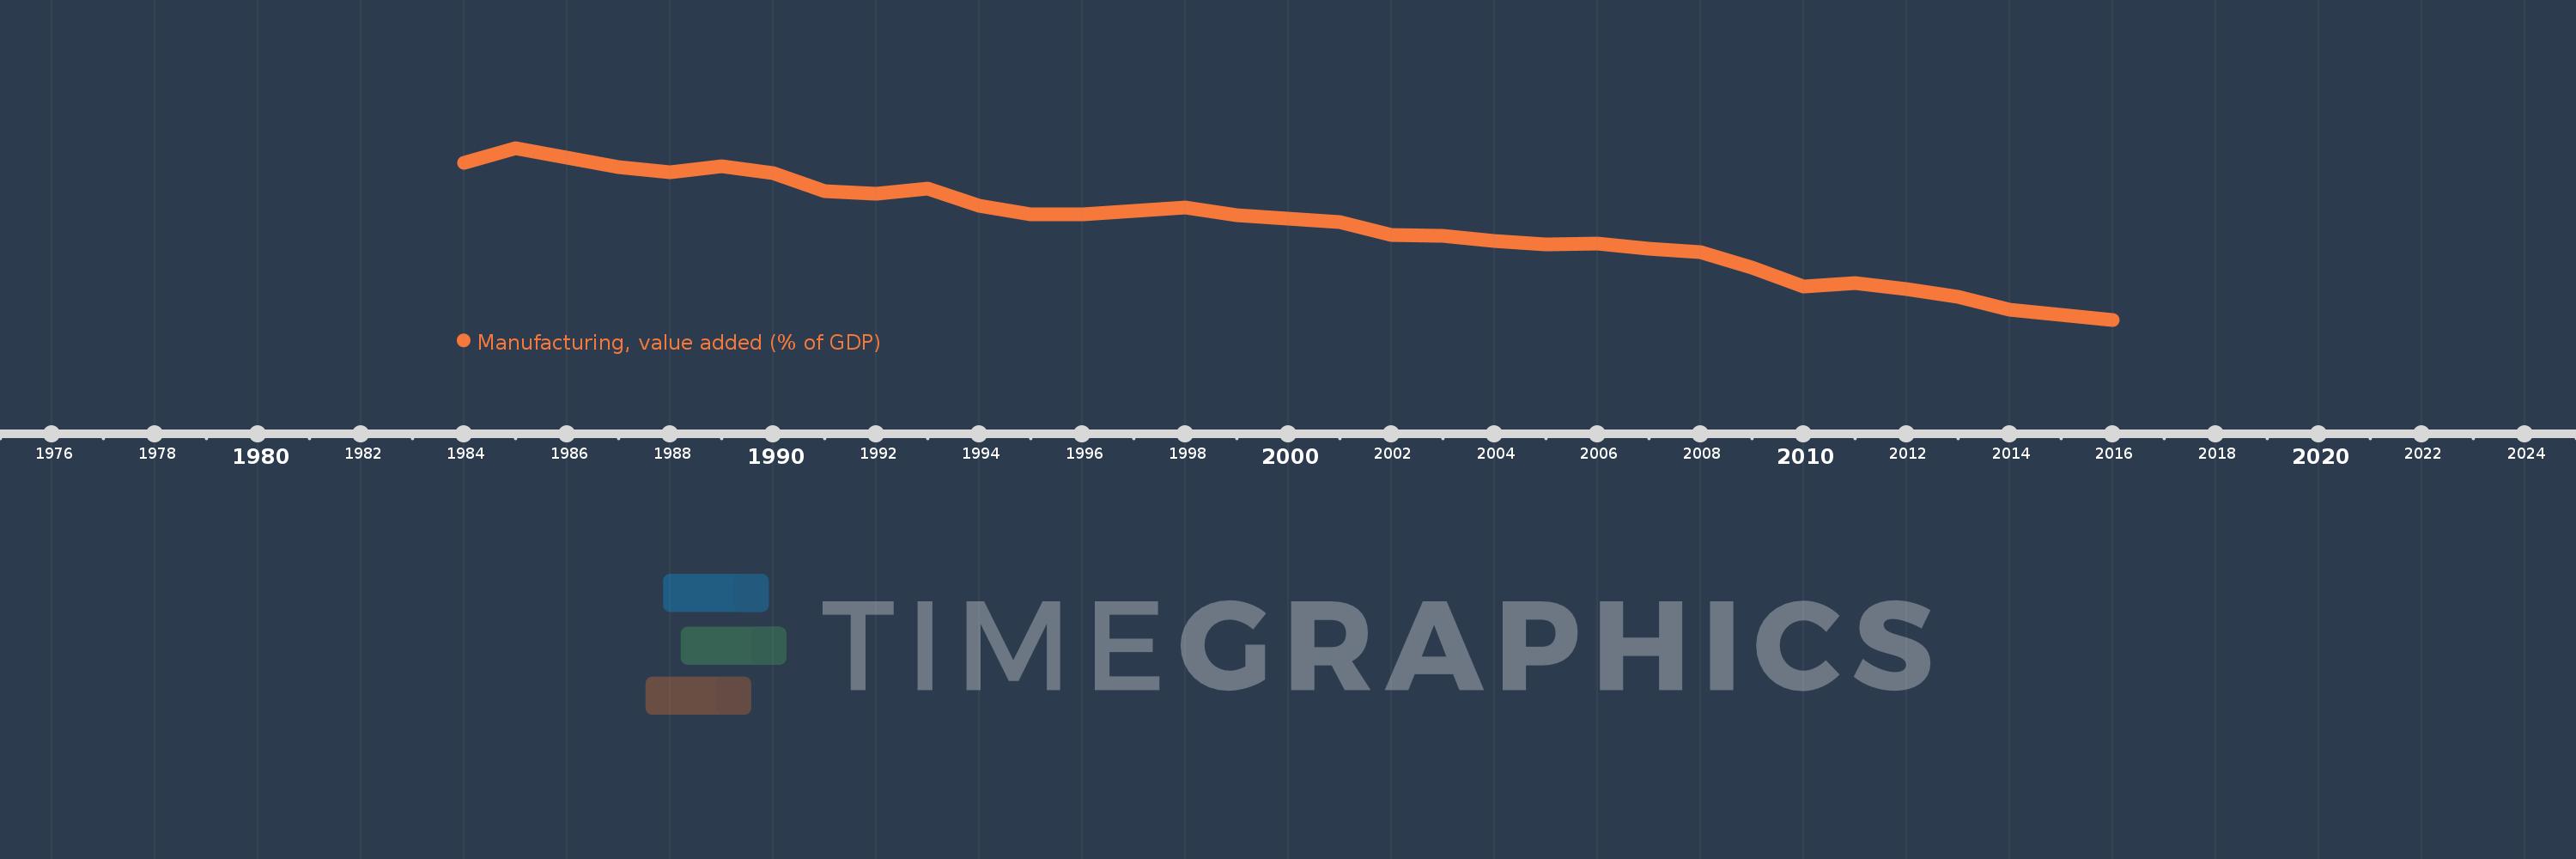
Manufacturing, value added (% of GDP)
2016,2015,2014,2013,2012,2011,2010,2009,2008,2007,2006,2005,2004,2003,2002,2001,2000,1999,1998,1997,1996,1995,1994,1993,1992,1991,1990,1989,1988,1987,1986,1985,1984
This statistics in other country:
AfghanistanAlbaniaAlgeriaAndorraAngolaAntigua and BarbudaArab WorldArgentinaArmeniaArubaAustraliaAustriaAzerbaijanBahamas, TheBahrainBangladeshBarbadosBelarusBelgiumBelizeBeninBermudaBhutanBoliviaBosnia and HerzegovinaBotswanaBrazilBrunei DarussalamBurkina FasoBurundiCabo VerdeCambodiaCameroonCanadaCaribbean small statesCayman IslandsCentral African RepublicCentral Europe and the BalticsChadChileChinaColombiaComorosCongo, Dem. Rep.Congo, Rep.Costa RicaCote d'IvoireCroatiaCubaCyprusCzech RepublicDenmarkDjiboutiDominicaDominican RepublicEarly-demographic dividendEast Asia & PacificEast Asia & Pacific (excluding high income)East Asia & Pacific (IDA & IBRD countries)EcuadorEgypt, Arab Rep.El SalvadorEquatorial GuineaEritreaEstoniaEthiopiaEuro areaEurope & Central AsiaEurope & Central Asia (excluding high income)Europe & Central Asia (IDA & IBRD countries)European UnionFaroe IslandsFijiFinlandFragile and conflict affected situationsFranceGabonGambia, TheGeorgiaGermanyGhanaGreeceGrenadaGuatemalaGuineaGuinea-BissauGuyanaHeavily indebted poor countries (HIPC)High incomeHondurasHong Kong SAR, ChinaHungaryIBRD onlyIcelandIDA & IBRD totalIDA blendIDA onlyIDA totalIndiaIndonesiaIran, Islamic Rep.IrelandItalyJamaicaJapanJordanKazakhstanKenyaKiribatiKorea, Rep.KosovoKuwaitKyrgyz RepublicLao PDRLate-demographic dividendLatin America & Caribbean Latin America & Caribbean (excluding high income)Latin America & the Caribbean (IDA & IBRD countries)LatviaLeast developed countries: UN classificationLebanonLesothoLibyaLithuaniaLow & middle incomeLow incomeLower middle incomeLuxembourgMacao SAR, ChinaMacedonia, FYRMadagascarMalawiMalaysiaMaldivesMaliMaltaMarshall IslandsMauritaniaMauritiusMexicoMicronesia, Fed. Sts.Middle East & North AfricaMiddle East & North Africa (excluding high income)Middle East & North Africa (IDA & IBRD countries)Middle incomeMoldovaMongoliaMontenegroMoroccoMozambiqueMyanmarNamibiaNepalNetherlandsNew CaledoniaNew ZealandNicaraguaNigerNigeriaNorth AmericaNorwayOECD membersOmanOther small statesPacific island small statesPakistanPalauPanamaPapua New GuineaParaguayPeruPhilippinesPolandPortugalPost-demographic dividendPre-demographic dividendPuerto RicoQatarRomaniaRussian FederationRwandaSao Tome and PrincipeSaudi ArabiaSenegalSerbiaSeychellesSierra LeoneSingaporeSlovak RepublicSloveniaSmall statesSolomon IslandsSomaliaSouth AfricaSouth AsiaSouth Asia (IDA & IBRD)SpainSri LankaSt. Kitts and NevisSt. LuciaSt. Vincent and the GrenadinesSub-Saharan Africa Sub-Saharan Africa (excluding high income)Sub-Saharan Africa (IDA & IBRD countries)SudanSurinameSwazilandSwedenSwitzerlandSyrian Arab RepublicTajikistanTanzaniaThailandTimor-LesteTogoTongaTrinidad and TobagoTunisiaTurkeyTurkmenistanTuvaluUgandaUkraineUnited KingdomUnited StatesUpper middle incomeUruguayUzbekistanVanuatuVenezuela, RBVietnamWest Bank and GazaWorldYemen, Rep.ZambiaZimbabwe Timeline:
This timeline shows a graph from 1984 to 2016 of Costa Rica. No data until 1983. Number of actual observations by date: 33.
Source name:
World Development Indicators
Source organization:
World Bank national accounts data, and OECD National Accounts data files.
Categories, topics:
Economy & Growth
Last updated:
apr 23, 2017
Indicators value changes by year
Minimum:
13.037
jan 1, 2016
Maximum:
25.856
jan 1, 1985
At the date of observation
Value
Absolute change
Change from previous value
jan 1, 1984
24.762
+24.762
0.0%
jan 1, 1985
25.856
+1.093
4.41%
jan 1, 1986
25.125
-0.731
-2.83%
jan 1, 1987
24.416
-0.709
-2.82%
jan 1, 1988
24.034
-0.381
-1.56%
jan 1, 1989
24.482
+0.447
1.86%
jan 1, 1990
23.957
-0.524
-2.14%
jan 1, 1991
22.624
-1.333
-5.56%
jan 1, 1992
22.421
-0.202
-0.9%
jan 1, 1993
22.812
+0.391
1.74%
jan 1, 1994
21.555
-1.257
-5.51%
jan 1, 1995
20.898
-0.657
-3.05%
jan 1, 1996
20.882
-0.016
-0.08%
jan 1, 1997
21.142
+0.26
1.25%
jan 1, 1998
21.443
+0.301
1.42%
jan 1, 1999
20.811
-0.632
-2.95%
jan 1, 2000
20.606
-0.205
-0.98%
jan 1, 2001
20.319
-0.287
-1.39%
jan 1, 2002
19.387
-0.932
-4.59%
jan 1, 2003
19.325
-0.062
-0.32%
jan 1, 2004
18.928
-0.397
-2.05%
jan 1, 2005
18.686
-0.242
-1.28%
jan 1, 2006
18.695
+0.01
0.05%
jan 1, 2007
18.352
-0.343
-1.84%
jan 1, 2008
18.072
-0.281
-1.53%
jan 1, 2009
16.939
-1.132
-6.27%
jan 1, 2010
15.547
-1.393
-8.22%
jan 1, 2011
15.783
+0.237
1.52%
jan 1, 2012
15.32
-0.464
-2.94%
jan 1, 2013
14.757
-0.563
-3.68%
jan 1, 2014
13.785
-0.972
-6.59%
jan 1, 2015
13.408
-0.377
-2.73%
jan 1, 2016
13.037
-0.371
-2.77%
Ranking of countries by current statistics by years


Comments: