29
/
en
AIzaSyAYiBZKx7MnpbEhh9jyipgxe19OcubqV5w
April 1, 2024
250056
St. Kitts and Nevis
KNA
true
2
1
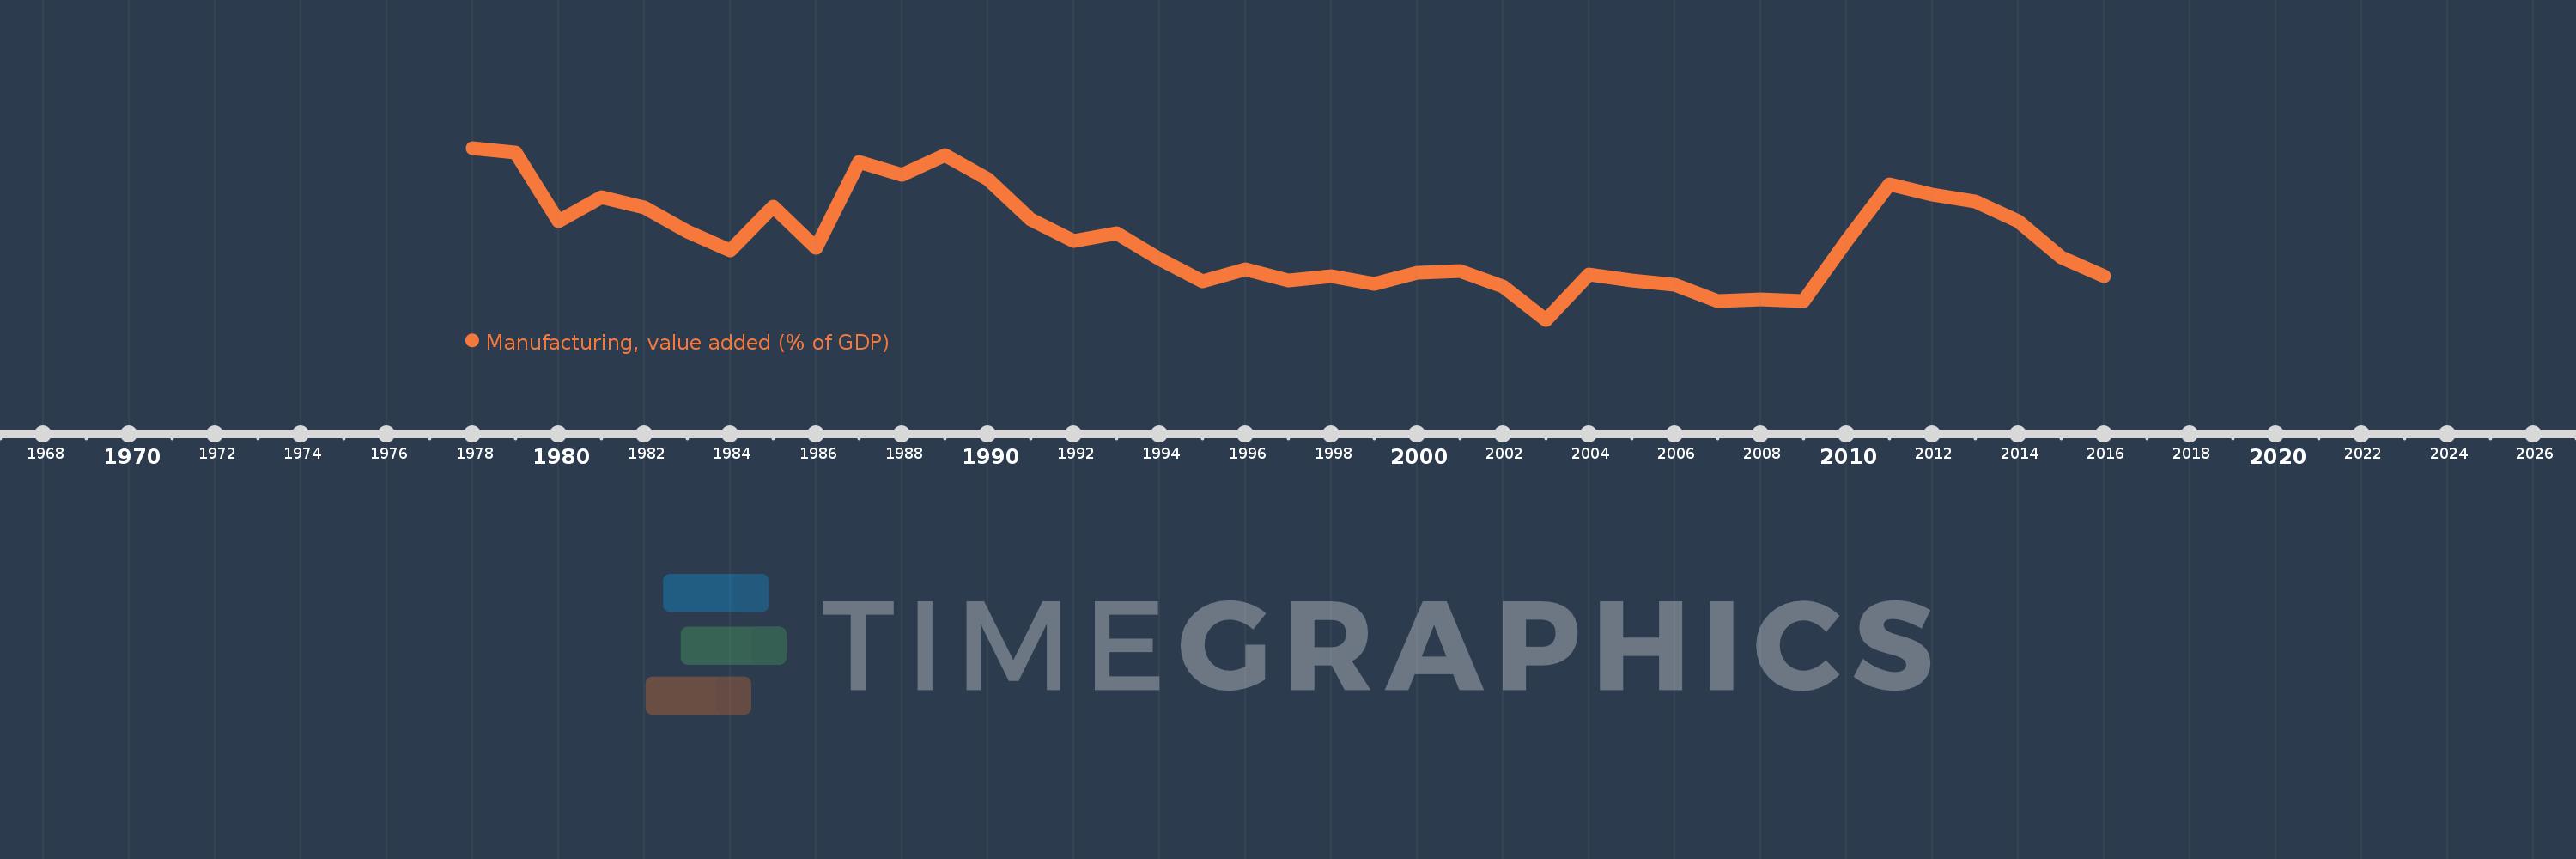
Manufacturing, value added (% of GDP)
2016,2015,2014,2013,2012,2011,2010,2009,2008,2007,2006,2005,2004,2003,2002,2001,2000,1999,1998,1997,1996,1995,1994,1993,1992,1991,1990,1989,1988,1987,1986,1985,1984,1983,1982,1981,1980,1979,1978
This statistics in other country:
AfghanistanAlbaniaAlgeriaAndorraAngolaAntigua and BarbudaArab WorldArgentinaArmeniaArubaAustraliaAustriaAzerbaijanBahamas, TheBahrainBangladeshBarbadosBelarusBelgiumBelizeBeninBermudaBhutanBoliviaBosnia and HerzegovinaBotswanaBrazilBrunei DarussalamBurkina FasoBurundiCabo VerdeCambodiaCameroonCanadaCaribbean small statesCayman IslandsCentral African RepublicCentral Europe and the BalticsChadChileChinaColombiaComorosCongo, Dem. Rep.Congo, Rep.Costa RicaCote d'IvoireCroatiaCubaCyprusCzech RepublicDenmarkDjiboutiDominicaDominican RepublicEarly-demographic dividendEast Asia & PacificEast Asia & Pacific (excluding high income)East Asia & Pacific (IDA & IBRD countries)EcuadorEgypt, Arab Rep.El SalvadorEquatorial GuineaEritreaEstoniaEthiopiaEuro areaEurope & Central AsiaEurope & Central Asia (excluding high income)Europe & Central Asia (IDA & IBRD countries)European UnionFaroe IslandsFijiFinlandFragile and conflict affected situationsFranceGabonGambia, TheGeorgiaGermanyGhanaGreeceGrenadaGuatemalaGuineaGuinea-BissauGuyanaHeavily indebted poor countries (HIPC)High incomeHondurasHong Kong SAR, ChinaHungaryIBRD onlyIcelandIDA & IBRD totalIDA blendIDA onlyIDA totalIndiaIndonesiaIran, Islamic Rep.IrelandItalyJamaicaJapanJordanKazakhstanKenyaKiribatiKorea, Rep.KosovoKuwaitKyrgyz RepublicLao PDRLate-demographic dividendLatin America & Caribbean Latin America & Caribbean (excluding high income)Latin America & the Caribbean (IDA & IBRD countries)LatviaLeast developed countries: UN classificationLebanonLesothoLibyaLithuaniaLow & middle incomeLow incomeLower middle incomeLuxembourgMacao SAR, ChinaMacedonia, FYRMadagascarMalawiMalaysiaMaldivesMaliMaltaMarshall IslandsMauritaniaMauritiusMexicoMicronesia, Fed. Sts.Middle East & North AfricaMiddle East & North Africa (excluding high income)Middle East & North Africa (IDA & IBRD countries)Middle incomeMoldovaMongoliaMontenegroMoroccoMozambiqueMyanmarNamibiaNepalNetherlandsNew CaledoniaNew ZealandNicaraguaNigerNigeriaNorth AmericaNorwayOECD membersOmanOther small statesPacific island small statesPakistanPalauPanamaPapua New GuineaParaguayPeruPhilippinesPolandPortugalPost-demographic dividendPre-demographic dividendPuerto RicoQatarRomaniaRussian FederationRwandaSao Tome and PrincipeSaudi ArabiaSenegalSerbiaSeychellesSierra LeoneSingaporeSlovak RepublicSloveniaSmall statesSolomon IslandsSomaliaSouth AfricaSouth AsiaSouth Asia (IDA & IBRD)SpainSri LankaSt. Kitts and NevisSt. LuciaSt. Vincent and the GrenadinesSub-Saharan Africa Sub-Saharan Africa (excluding high income)Sub-Saharan Africa (IDA & IBRD countries)SudanSurinameSwazilandSwedenSwitzerlandSyrian Arab RepublicTajikistanTanzaniaThailandTimor-LesteTogoTongaTrinidad and TobagoTunisiaTurkeyTurkmenistanTuvaluUgandaUkraineUnited KingdomUnited StatesUpper middle incomeUruguayUzbekistanVanuatuVenezuela, RBVietnamWest Bank and GazaWorldYemen, Rep.ZambiaZimbabwe Timeline:
This timeline shows a graph from 1978 to 2016 of St. Kitts and Nevis. No data until 1977. Number of actual observations by date: 39.
Source name:
World Development Indicators
Source organization:
World Bank national accounts data, and OECD National Accounts data files.
Categories, topics:
Economy & Growth
Last updated:
apr 23, 2017
Indicators value changes by year
Maximum:
11.456
jan 1, 1978
At the date of observation
Value
Absolute change
Change from previous value
jan 1, 1978
11.456
+11.456
0.0%
jan 1, 1979
11.327
-0.129
-1.13%
jan 1, 1980
9.306
-2.021
-17.84%
jan 1, 1981
10.019
+0.713
7.66%
jan 1, 1982
9.702
-0.317
-3.16%
jan 1, 1983
9.012
-0.69
-7.11%
jan 1, 1984
8.463
-0.549
-6.1%
jan 1, 1985
9.73
+1.267
14.97%
jan 1, 1986
8.53
-1.2
-12.33%
jan 1, 1987
11.047
+2.516
29.5%
jan 1, 1988
10.68
-0.367
-3.32%
jan 1, 1989
11.24
+0.56
5.24%
jan 1, 1990
10.539
-0.701
-6.23%
jan 1, 1991
9.359
-1.18
-11.2%
jan 1, 1992
8.738
-0.621
-6.64%
jan 1, 1993
8.966
+0.228
2.61%
jan 1, 1994
8.208
-0.758
-8.45%
jan 1, 1995
7.559
-0.649
-7.91%
jan 1, 1996
7.911
+0.352
4.65%
jan 1, 1997
7.586
-0.324
-4.1%
jan 1, 1998
7.697
+0.111
1.46%
jan 1, 1999
7.469
-0.229
-2.97%
jan 1, 2000
7.801
+0.332
4.45%
jan 1, 2001
7.849
+0.048
0.61%
jan 1, 2002
7.395
-0.453
-5.78%
jan 1, 2003
6.43
-0.965
-13.05%
jan 1, 2004
7.76
+1.33
20.68%
jan 1, 2005
7.57
-0.19
-2.45%
jan 1, 2006
7.45
-0.12
-1.58%
jan 1, 2007
6.985
-0.465
-6.24%
jan 1, 2008
7.027
+0.042
0.6%
jan 1, 2009
6.964
-0.063
-0.89%
jan 1, 2010
8.726
+1.761
25.29%
jan 1, 2011
10.392
+1.666
19.09%
jan 1, 2012
10.1
-0.291
-2.8%
jan 1, 2013
9.878
-0.223
-2.2%
jan 1, 2014
9.304
-0.573
-5.8%
jan 1, 2015
8.269
-1.036
-11.13%
jan 1, 2016
7.696
-0.573
-6.93%
Ranking of countries by current statistics by years


Comments: