29
/
en
AIzaSyAYiBZKx7MnpbEhh9jyipgxe19OcubqV5w
April 1, 2024
222455
Peru
PER
true
2
1
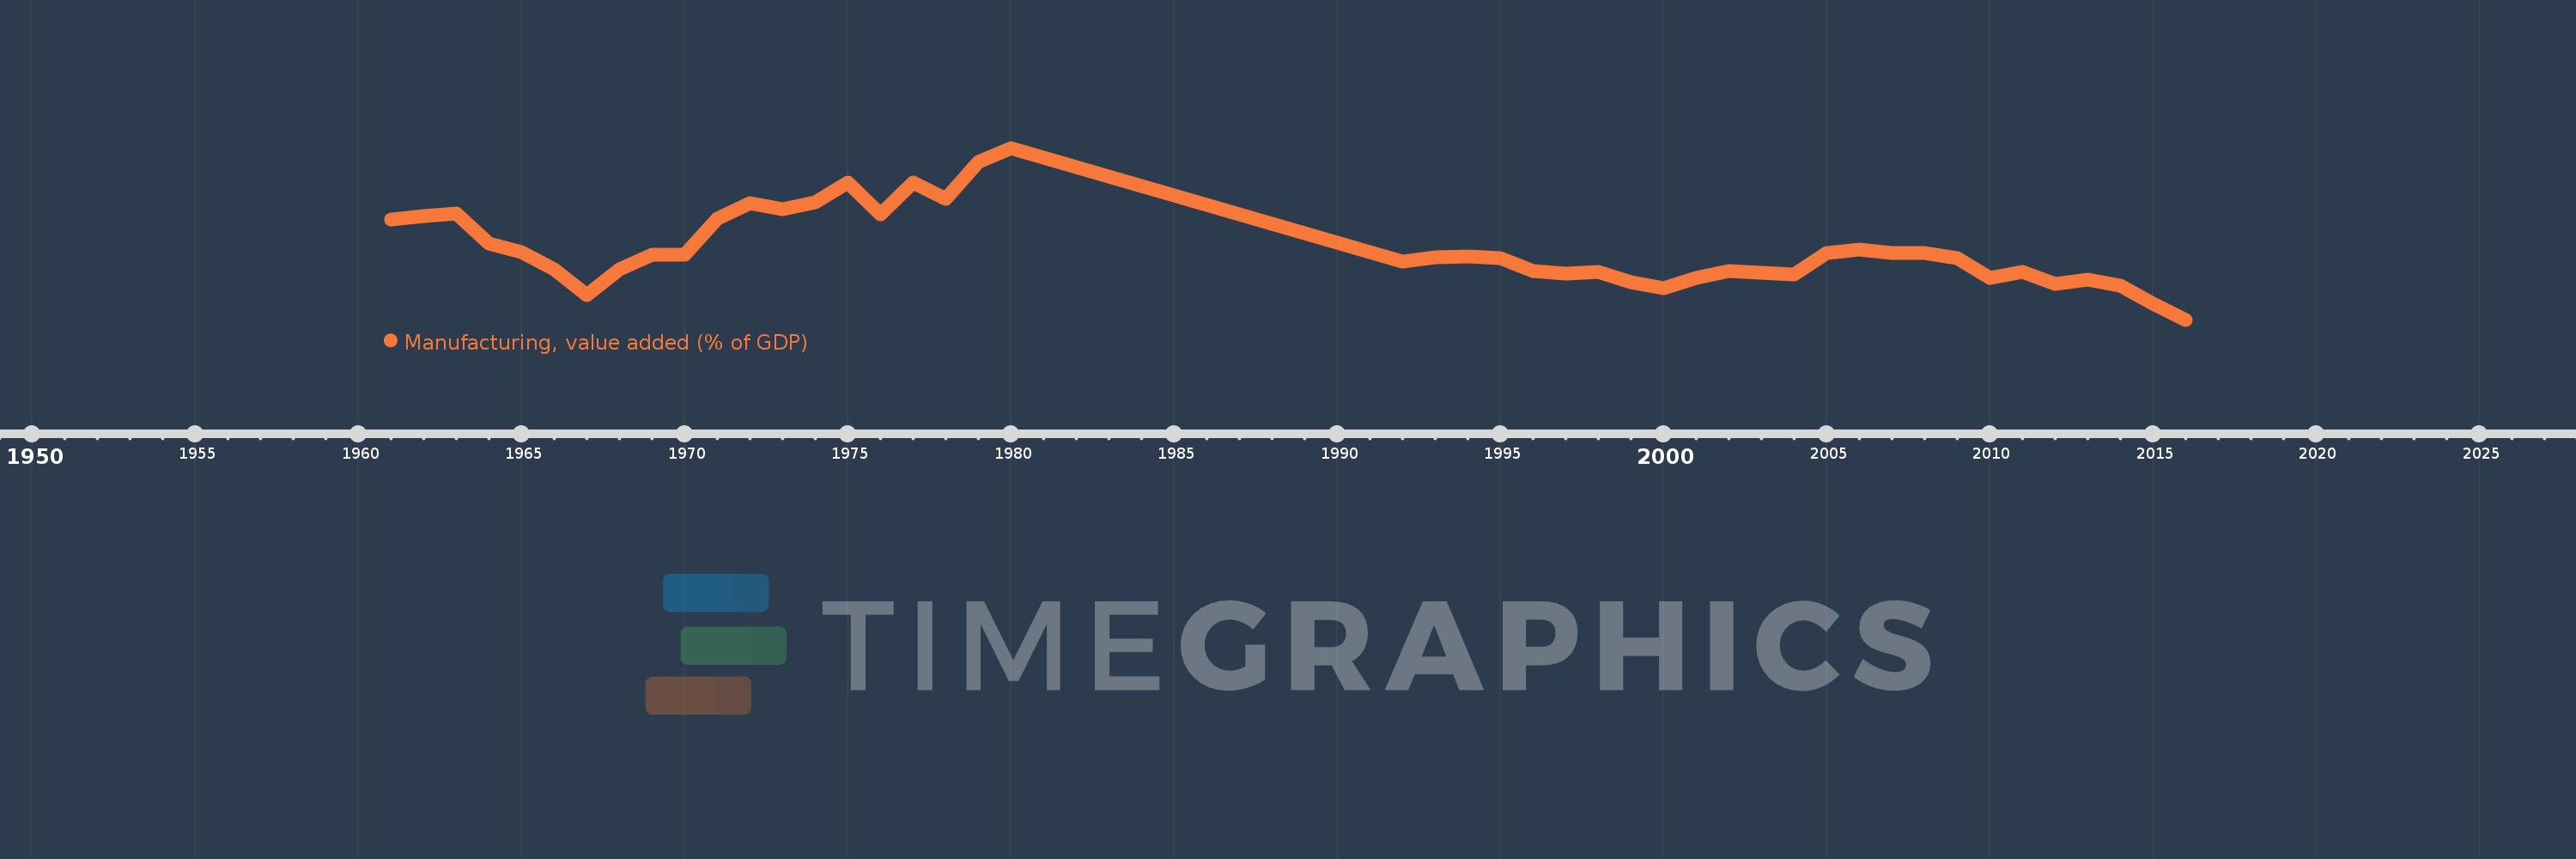
Manufacturing, value added (% of GDP)
2016,2015,2014,2013,2012,2011,2010,2009,2008,2007,2006,2005,2004,2003,2002,2001,2000,1999,1998,1997,1996,1995,1994,1993,1992,1980,1979,1978,1977,1976,1975,1974,1973,1972,1971,1970,1969,1968,1967,1966,1965,1964,1963,1962,1961
This statistics in other country:
AfghanistanAlbaniaAlgeriaAndorraAngolaAntigua and BarbudaArab WorldArgentinaArmeniaArubaAustraliaAustriaAzerbaijanBahamas, TheBahrainBangladeshBarbadosBelarusBelgiumBelizeBeninBermudaBhutanBoliviaBosnia and HerzegovinaBotswanaBrazilBrunei DarussalamBurkina FasoBurundiCabo VerdeCambodiaCameroonCanadaCaribbean small statesCayman IslandsCentral African RepublicCentral Europe and the BalticsChadChileChinaColombiaComorosCongo, Dem. Rep.Congo, Rep.Costa RicaCote d'IvoireCroatiaCubaCyprusCzech RepublicDenmarkDjiboutiDominicaDominican RepublicEarly-demographic dividendEast Asia & PacificEast Asia & Pacific (excluding high income)East Asia & Pacific (IDA & IBRD countries)EcuadorEgypt, Arab Rep.El SalvadorEquatorial GuineaEritreaEstoniaEthiopiaEuro areaEurope & Central AsiaEurope & Central Asia (excluding high income)Europe & Central Asia (IDA & IBRD countries)European UnionFaroe IslandsFijiFinlandFragile and conflict affected situationsFranceGabonGambia, TheGeorgiaGermanyGhanaGreeceGrenadaGuatemalaGuineaGuinea-BissauGuyanaHeavily indebted poor countries (HIPC)High incomeHondurasHong Kong SAR, ChinaHungaryIBRD onlyIcelandIDA & IBRD totalIDA blendIDA onlyIDA totalIndiaIndonesiaIran, Islamic Rep.IrelandItalyJamaicaJapanJordanKazakhstanKenyaKiribatiKorea, Rep.KosovoKuwaitKyrgyz RepublicLao PDRLate-demographic dividendLatin America & Caribbean Latin America & Caribbean (excluding high income)Latin America & the Caribbean (IDA & IBRD countries)LatviaLeast developed countries: UN classificationLebanonLesothoLibyaLithuaniaLow & middle incomeLow incomeLower middle incomeLuxembourgMacao SAR, ChinaMacedonia, FYRMadagascarMalawiMalaysiaMaldivesMaliMaltaMarshall IslandsMauritaniaMauritiusMexicoMicronesia, Fed. Sts.Middle East & North AfricaMiddle East & North Africa (excluding high income)Middle East & North Africa (IDA & IBRD countries)Middle incomeMoldovaMongoliaMontenegroMoroccoMozambiqueMyanmarNamibiaNepalNetherlandsNew CaledoniaNew ZealandNicaraguaNigerNigeriaNorth AmericaNorwayOECD membersOmanOther small statesPacific island small statesPakistanPalauPanamaPapua New GuineaParaguayPeruPhilippinesPolandPortugalPost-demographic dividendPre-demographic dividendPuerto RicoQatarRomaniaRussian FederationRwandaSao Tome and PrincipeSaudi ArabiaSenegalSerbiaSeychellesSierra LeoneSingaporeSlovak RepublicSloveniaSmall statesSolomon IslandsSomaliaSouth AfricaSouth AsiaSouth Asia (IDA & IBRD)SpainSri LankaSt. Kitts and NevisSt. LuciaSt. Vincent and the GrenadinesSub-Saharan Africa Sub-Saharan Africa (excluding high income)Sub-Saharan Africa (IDA & IBRD countries)SudanSurinameSwazilandSwedenSwitzerlandSyrian Arab RepublicTajikistanTanzaniaThailandTimor-LesteTogoTongaTrinidad and TobagoTunisiaTurkeyTurkmenistanTuvaluUgandaUkraineUnited KingdomUnited StatesUpper middle incomeUruguayUzbekistanVanuatuVenezuela, RBVietnamWest Bank and GazaWorldYemen, Rep.ZambiaZimbabwe Timeline:
This timeline shows a graph from 1961 to 2016 of Peru. No data until 1960. Number of actual observations by date: 45.
Source name:
World Development Indicators
Source organization:
World Bank national accounts data, and OECD National Accounts data files.
Categories, topics:
Economy & Growth
Last updated:
apr 23, 2017
Indicators value changes by year
Minimum:
14.501
jan 1, 2016
Maximum:
23.489
jan 1, 1980
At the date of observation
Value
Absolute change
Change from previous value
jan 1, 1961
19.747
+19.747
0.0%
jan 1, 1962
19.912
+0.166
0.84%
jan 1, 1963
20.06
+0.148
0.74%
jan 1, 1964
18.5
-1.561
-7.78%
jan 1, 1965
18.057
-0.442
-2.39%
jan 1, 1966
17.136
-0.921
-5.1%
jan 1, 1967
15.799
-1.337
-7.8%
jan 1, 1968
17.16
+1.361
8.61%
jan 1, 1969
17.908
+0.748
4.36%
jan 1, 1970
17.9
-0.008
-0.05%
jan 1, 1971
19.786
+1.886
10.53%
jan 1, 1972
20.621
+0.835
4.22%
jan 1, 1973
20.306
-0.315
-1.53%
jan 1, 1974
20.642
+0.336
1.65%
jan 1, 1975
21.663
+1.02
4.94%
jan 1, 1976
20.033
-1.629
-7.52%
jan 1, 1977
21.677
+1.644
8.2%
jan 1, 1978
20.843
-0.833
-3.84%
jan 1, 1979
22.763
+1.92
9.21%
jan 1, 1980
23.489
+0.726
3.19%
jan 1, 1992
17.528
-5.962
-25.38%
jan 1, 1993
17.757
+0.229
1.31%
jan 1, 1994
17.826
+0.069
0.39%
jan 1, 1995
17.727
-0.099
-0.55%
jan 1, 1996
17.029
-0.699
-3.94%
jan 1, 1997
16.925
-0.104
-0.61%
jan 1, 1998
16.982
+0.058
0.34%
jan 1, 1999
16.448
-0.534
-3.15%
jan 1, 2000
16.148
-0.3
-1.83%
jan 1, 2001
16.695
+0.547
3.39%
jan 1, 2002
17.039
+0.344
2.06%
jan 1, 2003
16.946
-0.093
-0.54%
jan 1, 2004
16.891
-0.055
-0.32%
jan 1, 2005
17.997
+1.106
6.55%
jan 1, 2006
18.179
+0.182
1.01%
jan 1, 2007
18.007
-0.172
-0.95%
jan 1, 2008
18.011
+0.005
0.03%
jan 1, 2009
17.742
-0.269
-1.49%
jan 1, 2010
16.679
-1.064
-5.99%
jan 1, 2011
16.994
+0.315
1.89%
jan 1, 2012
16.387
-0.607
-3.57%
jan 1, 2013
16.593
+0.206
1.26%
jan 1, 2014
16.287
-0.307
-1.85%
jan 1, 2015
15.331
-0.956
-5.87%
jan 1, 2016
14.501
-0.83
-5.41%
Ranking of countries by current statistics by years


Comments: