29
/
en
AIzaSyAYiBZKx7MnpbEhh9jyipgxe19OcubqV5w
April 1, 2024
267084
Trinidad and Tobago
TTO
true
2
1
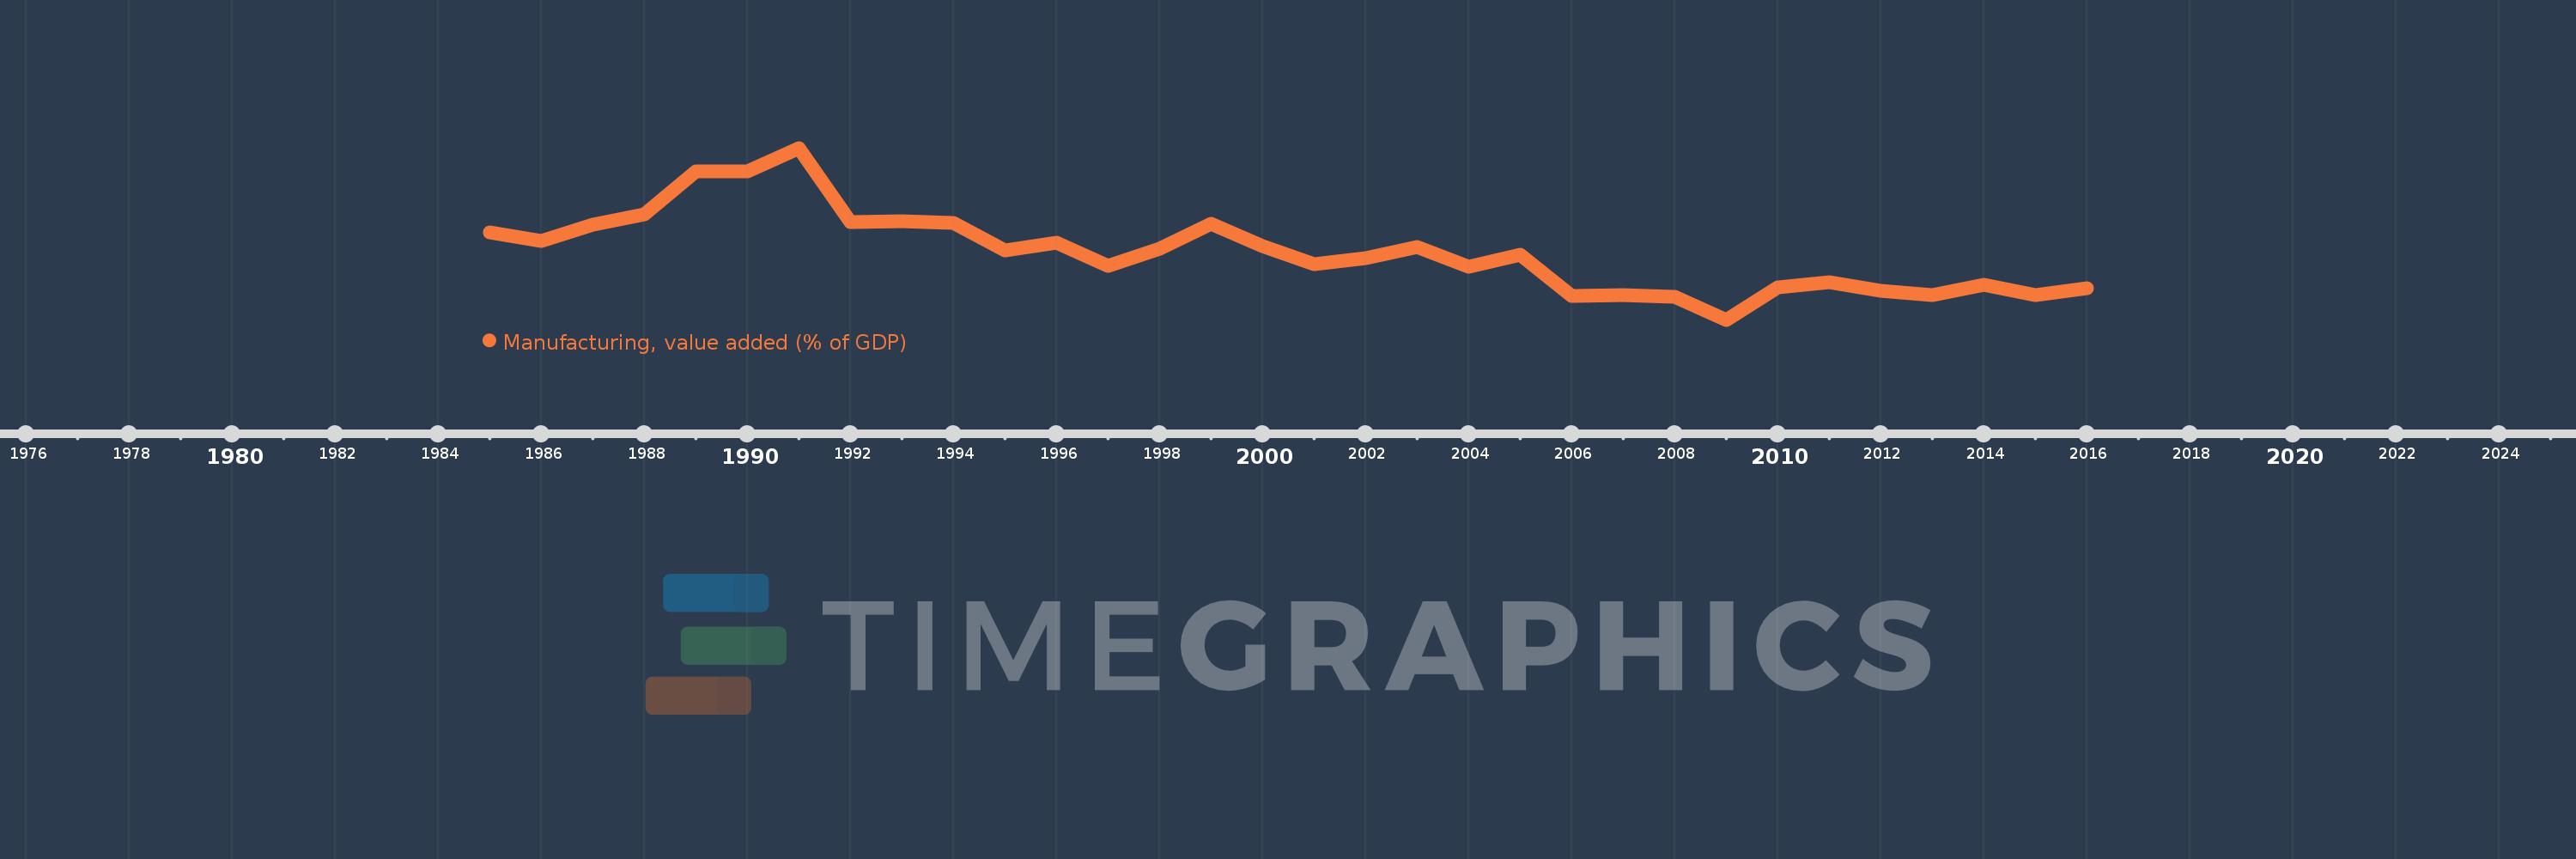
Manufacturing, value added (% of GDP)
2016,2015,2014,2013,2012,2011,2010,2009,2008,2007,2006,2005,2004,2003,2002,2001,2000,1999,1998,1997,1996,1995,1994,1993,1992,1991,1990,1989,1988,1987,1986,1985
This statistics in other country:
AfghanistanAlbaniaAlgeriaAndorraAngolaAntigua and BarbudaArab WorldArgentinaArmeniaArubaAustraliaAustriaAzerbaijanBahamas, TheBahrainBangladeshBarbadosBelarusBelgiumBelizeBeninBermudaBhutanBoliviaBosnia and HerzegovinaBotswanaBrazilBrunei DarussalamBurkina FasoBurundiCabo VerdeCambodiaCameroonCanadaCaribbean small statesCayman IslandsCentral African RepublicCentral Europe and the BalticsChadChileChinaColombiaComorosCongo, Dem. Rep.Congo, Rep.Costa RicaCote d'IvoireCroatiaCubaCyprusCzech RepublicDenmarkDjiboutiDominicaDominican RepublicEarly-demographic dividendEast Asia & PacificEast Asia & Pacific (excluding high income)East Asia & Pacific (IDA & IBRD countries)EcuadorEgypt, Arab Rep.El SalvadorEquatorial GuineaEritreaEstoniaEthiopiaEuro areaEurope & Central AsiaEurope & Central Asia (excluding high income)Europe & Central Asia (IDA & IBRD countries)European UnionFaroe IslandsFijiFinlandFragile and conflict affected situationsFranceGabonGambia, TheGeorgiaGermanyGhanaGreeceGrenadaGuatemalaGuineaGuinea-BissauGuyanaHeavily indebted poor countries (HIPC)High incomeHondurasHong Kong SAR, ChinaHungaryIBRD onlyIcelandIDA & IBRD totalIDA blendIDA onlyIDA totalIndiaIndonesiaIran, Islamic Rep.IrelandItalyJamaicaJapanJordanKazakhstanKenyaKiribatiKorea, Rep.KosovoKuwaitKyrgyz RepublicLao PDRLate-demographic dividendLatin America & Caribbean Latin America & Caribbean (excluding high income)Latin America & the Caribbean (IDA & IBRD countries)LatviaLeast developed countries: UN classificationLebanonLesothoLibyaLithuaniaLow & middle incomeLow incomeLower middle incomeLuxembourgMacao SAR, ChinaMacedonia, FYRMadagascarMalawiMalaysiaMaldivesMaliMaltaMarshall IslandsMauritaniaMauritiusMexicoMicronesia, Fed. Sts.Middle East & North AfricaMiddle East & North Africa (excluding high income)Middle East & North Africa (IDA & IBRD countries)Middle incomeMoldovaMongoliaMontenegroMoroccoMozambiqueMyanmarNamibiaNepalNetherlandsNew CaledoniaNew ZealandNicaraguaNigerNigeriaNorth AmericaNorwayOECD membersOmanOther small statesPacific island small statesPakistanPalauPanamaPapua New GuineaParaguayPeruPhilippinesPolandPortugalPost-demographic dividendPre-demographic dividendPuerto RicoQatarRomaniaRussian FederationRwandaSao Tome and PrincipeSaudi ArabiaSenegalSerbiaSeychellesSierra LeoneSingaporeSlovak RepublicSloveniaSmall statesSolomon IslandsSomaliaSouth AfricaSouth AsiaSouth Asia (IDA & IBRD)SpainSri LankaSt. Kitts and NevisSt. LuciaSt. Vincent and the GrenadinesSub-Saharan Africa Sub-Saharan Africa (excluding high income)Sub-Saharan Africa (IDA & IBRD countries)SudanSurinameSwazilandSwedenSwitzerlandSyrian Arab RepublicTajikistanTanzaniaThailandTimor-LesteTogoTongaTrinidad and TobagoTunisiaTurkeyTurkmenistanTuvaluUgandaUkraineUnited KingdomUnited StatesUpper middle incomeUruguayUzbekistanVanuatuVenezuela, RBVietnamWest Bank and GazaWorldYemen, Rep.ZambiaZimbabwe Timeline:
This timeline shows a graph from 1985 to 2016 of Trinidad and Tobago. No data until 1984. Number of actual observations by date: 32.
Source name:
World Development Indicators
Source organization:
World Bank national accounts data, and OECD National Accounts data files.
Categories, topics:
Economy & Growth
Last updated:
apr 23, 2017
Indicators value changes by year
Maximum:
14.035
jan 1, 1991
At the date of observation
Value
Absolute change
Change from previous value
jan 1, 1985
9.195
+9.195
0.0%
jan 1, 1986
8.699
-0.496
-5.39%
jan 1, 1987
9.631
+0.932
10.71%
jan 1, 1988
10.23
+0.6
6.23%
jan 1, 1989
12.664
+2.434
23.79%
jan 1, 1990
12.709
+0.044
0.35%
jan 1, 1991
14.035
+1.326
10.44%
jan 1, 1992
9.793
-4.242
-30.22%
jan 1, 1993
9.824
+0.031
0.31%
jan 1, 1994
9.735
-0.089
-0.91%
jan 1, 1995
8.13
-1.605
-16.49%
jan 1, 1996
8.593
+0.464
5.7%
jan 1, 1997
7.273
-1.321
-15.37%
jan 1, 1998
8.243
+0.97
13.34%
jan 1, 1999
9.688
+1.446
17.54%
jan 1, 2000
8.395
-1.293
-13.35%
jan 1, 2001
7.347
-1.048
-12.48%
jan 1, 2002
7.713
+0.365
4.97%
jan 1, 2003
8.34
+0.627
8.13%
jan 1, 2004
7.188
-1.152
-13.81%
jan 1, 2005
7.897
+0.709
9.87%
jan 1, 2006
5.548
-2.349
-29.74%
jan 1, 2007
5.598
+0.05
0.9%
jan 1, 2008
5.483
-0.115
-2.06%
jan 1, 2009
4.159
-1.325
-24.16%
jan 1, 2010
6.005
+1.847
44.4%
jan 1, 2011
6.298
+0.293
4.88%
jan 1, 2012
5.832
-0.466
-7.4%
jan 1, 2013
5.592
-0.239
-4.1%
jan 1, 2014
6.185
+0.593
10.61%
jan 1, 2015
5.565
-0.62
-10.03%
jan 1, 2016
5.976
+0.41
7.38%
Ranking of countries by current statistics by years


Comments: