29
/
en
AIzaSyAYiBZKx7MnpbEhh9jyipgxe19OcubqV5w
April 1, 2024
213219
Nigeria
NGA
true
2
1
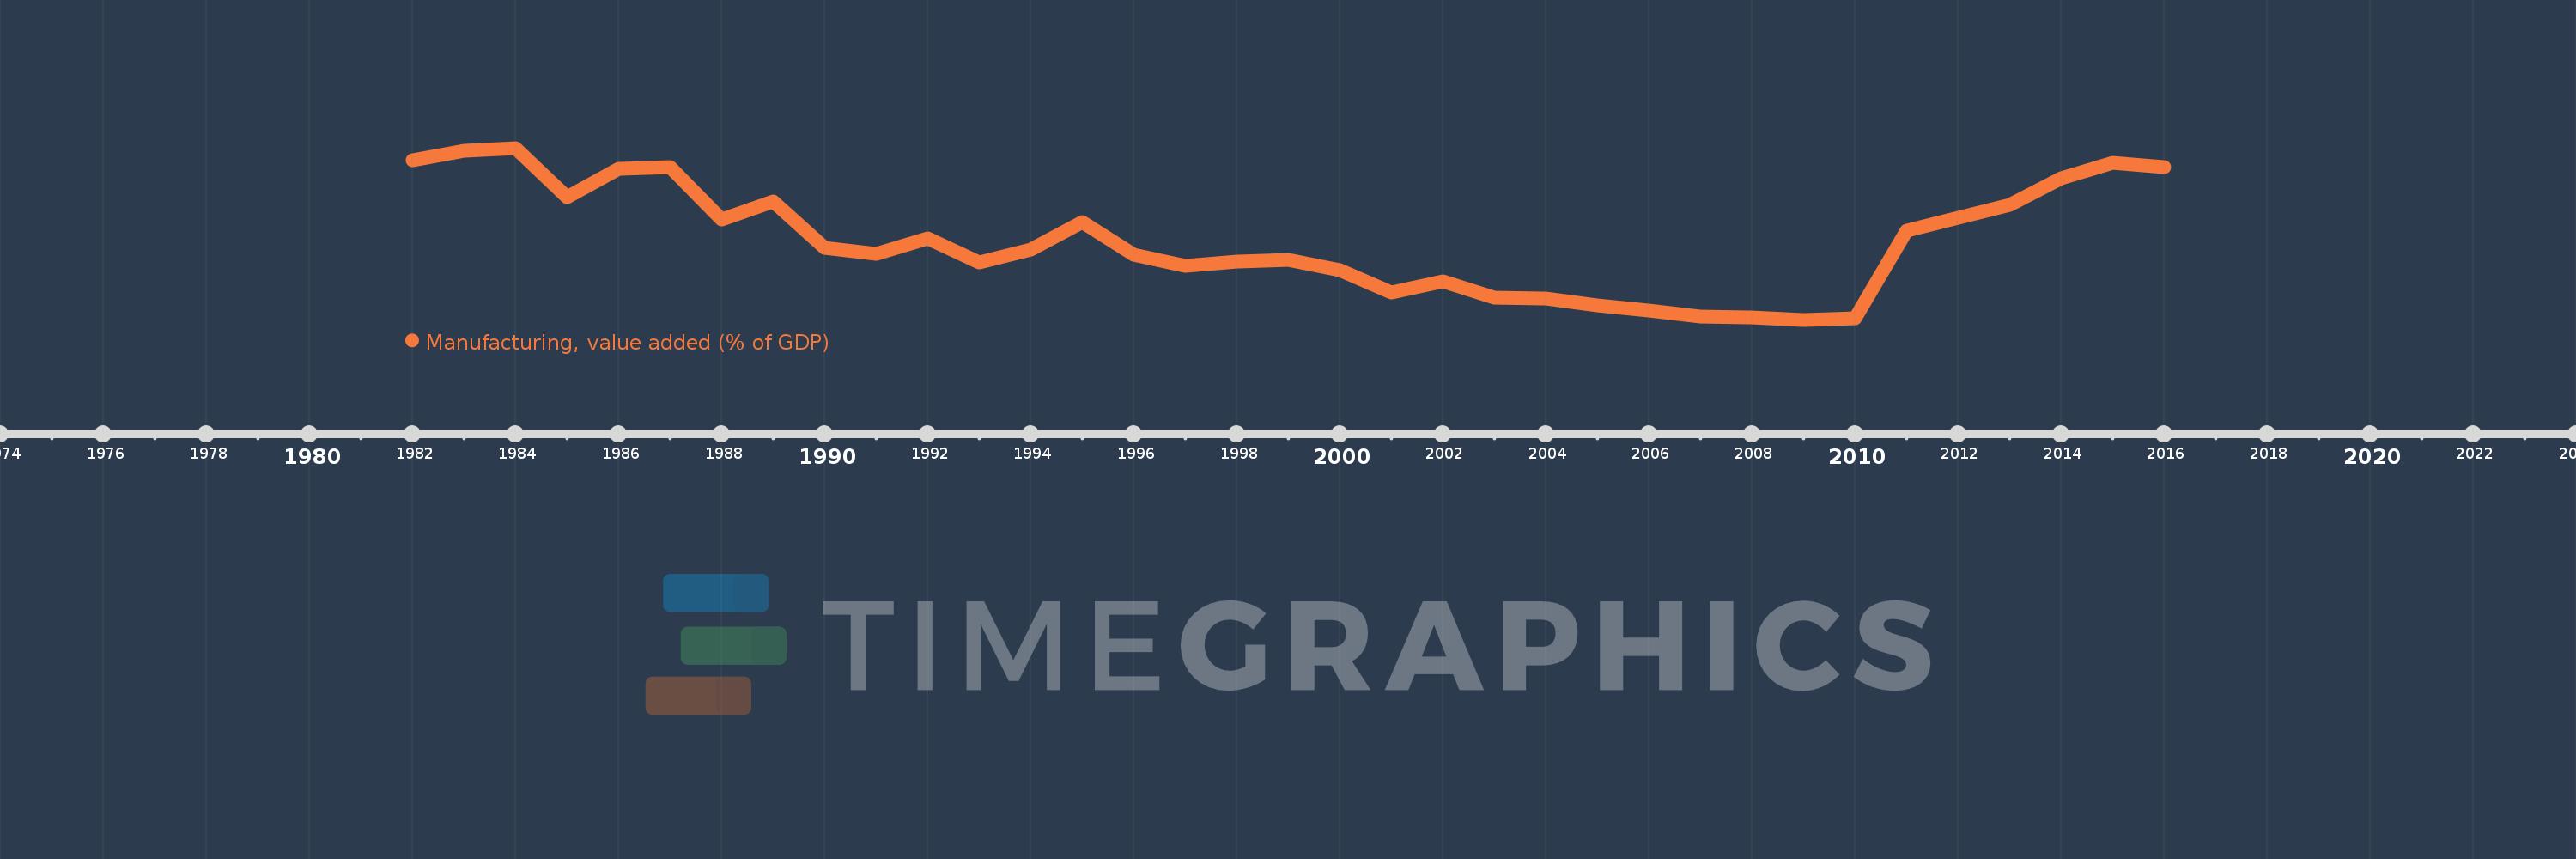
Manufacturing, value added (% of GDP)
2016,2015,2014,2013,2012,2011,2010,2009,2008,2007,2006,2005,2004,2003,2002,2001,2000,1999,1998,1997,1996,1995,1994,1993,1992,1991,1990,1989,1988,1987,1986,1985,1984,1983,1982
This statistics in other country:
AfghanistanAlbaniaAlgeriaAndorraAngolaAntigua and BarbudaArab WorldArgentinaArmeniaArubaAustraliaAustriaAzerbaijanBahamas, TheBahrainBangladeshBarbadosBelarusBelgiumBelizeBeninBermudaBhutanBoliviaBosnia and HerzegovinaBotswanaBrazilBrunei DarussalamBurkina FasoBurundiCabo VerdeCambodiaCameroonCanadaCaribbean small statesCayman IslandsCentral African RepublicCentral Europe and the BalticsChadChileChinaColombiaComorosCongo, Dem. Rep.Congo, Rep.Costa RicaCote d'IvoireCroatiaCubaCyprusCzech RepublicDenmarkDjiboutiDominicaDominican RepublicEarly-demographic dividendEast Asia & PacificEast Asia & Pacific (excluding high income)East Asia & Pacific (IDA & IBRD countries)EcuadorEgypt, Arab Rep.El SalvadorEquatorial GuineaEritreaEstoniaEthiopiaEuro areaEurope & Central AsiaEurope & Central Asia (excluding high income)Europe & Central Asia (IDA & IBRD countries)European UnionFaroe IslandsFijiFinlandFragile and conflict affected situationsFranceGabonGambia, TheGeorgiaGermanyGhanaGreeceGrenadaGuatemalaGuineaGuinea-BissauGuyanaHeavily indebted poor countries (HIPC)High incomeHondurasHong Kong SAR, ChinaHungaryIBRD onlyIcelandIDA & IBRD totalIDA blendIDA onlyIDA totalIndiaIndonesiaIran, Islamic Rep.IrelandItalyJamaicaJapanJordanKazakhstanKenyaKiribatiKorea, Rep.KosovoKuwaitKyrgyz RepublicLao PDRLate-demographic dividendLatin America & Caribbean Latin America & Caribbean (excluding high income)Latin America & the Caribbean (IDA & IBRD countries)LatviaLeast developed countries: UN classificationLebanonLesothoLibyaLithuaniaLow & middle incomeLow incomeLower middle incomeLuxembourgMacao SAR, ChinaMacedonia, FYRMadagascarMalawiMalaysiaMaldivesMaliMaltaMarshall IslandsMauritaniaMauritiusMexicoMicronesia, Fed. Sts.Middle East & North AfricaMiddle East & North Africa (excluding high income)Middle East & North Africa (IDA & IBRD countries)Middle incomeMoldovaMongoliaMontenegroMoroccoMozambiqueMyanmarNamibiaNepalNetherlandsNew CaledoniaNew ZealandNicaraguaNigerNigeriaNorth AmericaNorwayOECD membersOmanOther small statesPacific island small statesPakistanPalauPanamaPapua New GuineaParaguayPeruPhilippinesPolandPortugalPost-demographic dividendPre-demographic dividendPuerto RicoQatarRomaniaRussian FederationRwandaSao Tome and PrincipeSaudi ArabiaSenegalSerbiaSeychellesSierra LeoneSingaporeSlovak RepublicSloveniaSmall statesSolomon IslandsSomaliaSouth AfricaSouth AsiaSouth Asia (IDA & IBRD)SpainSri LankaSt. Kitts and NevisSt. LuciaSt. Vincent and the GrenadinesSub-Saharan Africa Sub-Saharan Africa (excluding high income)Sub-Saharan Africa (IDA & IBRD countries)SudanSurinameSwazilandSwedenSwitzerlandSyrian Arab RepublicTajikistanTanzaniaThailandTimor-LesteTogoTongaTrinidad and TobagoTunisiaTurkeyTurkmenistanTuvaluUgandaUkraineUnited KingdomUnited StatesUpper middle incomeUruguayUzbekistanVanuatuVenezuela, RBVietnamWest Bank and GazaWorldYemen, Rep.ZambiaZimbabwe Timeline:
This timeline shows a graph from 1982 to 2016 of Nigeria. No data until 1981. Number of actual observations by date: 35.
Source name:
World Development Indicators
Source organization:
World Bank national accounts data, and OECD National Accounts data files.
Categories, topics:
Economy & Growth
Last updated:
apr 23, 2017
Indicators value changes by year
Maximum:
10.437
jan 1, 1984
At the date of observation
Value
Absolute change
Change from previous value
jan 1, 1982
9.87
+9.87
0.0%
jan 1, 1983
10.287
+0.417
4.22%
jan 1, 1984
10.437
+0.151
1.46%
jan 1, 1985
8.13
-2.307
-22.1%
jan 1, 1986
9.458
+1.327
16.33%
jan 1, 1987
9.532
+0.074
0.79%
jan 1, 1988
7.098
-2.434
-25.54%
jan 1, 1989
7.922
+0.824
11.61%
jan 1, 1990
5.754
-2.167
-27.36%
jan 1, 1991
5.495
-0.259
-4.51%
jan 1, 1992
6.201
+0.706
12.85%
jan 1, 1993
5.07
-1.131
-18.24%
jan 1, 1994
5.701
+0.631
12.44%
jan 1, 1995
6.99
+1.289
22.61%
jan 1, 1996
5.446
-1.543
-22.08%
jan 1, 1997
4.917
-0.529
-9.72%
jan 1, 1998
5.143
+0.226
4.59%
jan 1, 1999
5.224
+0.081
1.58%
jan 1, 2000
4.726
-0.498
-9.54%
jan 1, 2001
3.667
-1.059
-22.4%
jan 1, 2002
4.213
+0.546
14.89%
jan 1, 2003
3.426
-0.787
-18.68%
jan 1, 2004
3.39
-0.036
-1.04%
jan 1, 2005
3.061
-0.329
-9.71%
jan 1, 2006
2.832
-0.229
-7.48%
jan 1, 2007
2.578
-0.255
-8.99%
jan 1, 2008
2.522
-0.056
-2.18%
jan 1, 2009
2.41
-0.111
-4.42%
jan 1, 2010
2.47
+0.059
2.47%
jan 1, 2011
6.553
+4.083
165.34%
jan 1, 2012
7.189
+0.636
9.7%
jan 1, 2013
7.793
+0.605
8.41%
jan 1, 2014
9.031
+1.238
15.89%
jan 1, 2015
9.754
+0.723
8.0%
jan 1, 2016
9.532
-0.222
-2.28%
Ranking of countries by current statistics by years


Comments: