29
/
en
AIzaSyAYiBZKx7MnpbEhh9jyipgxe19OcubqV5w
April 1, 2024
231303
Rwanda
RWA
true
2
1
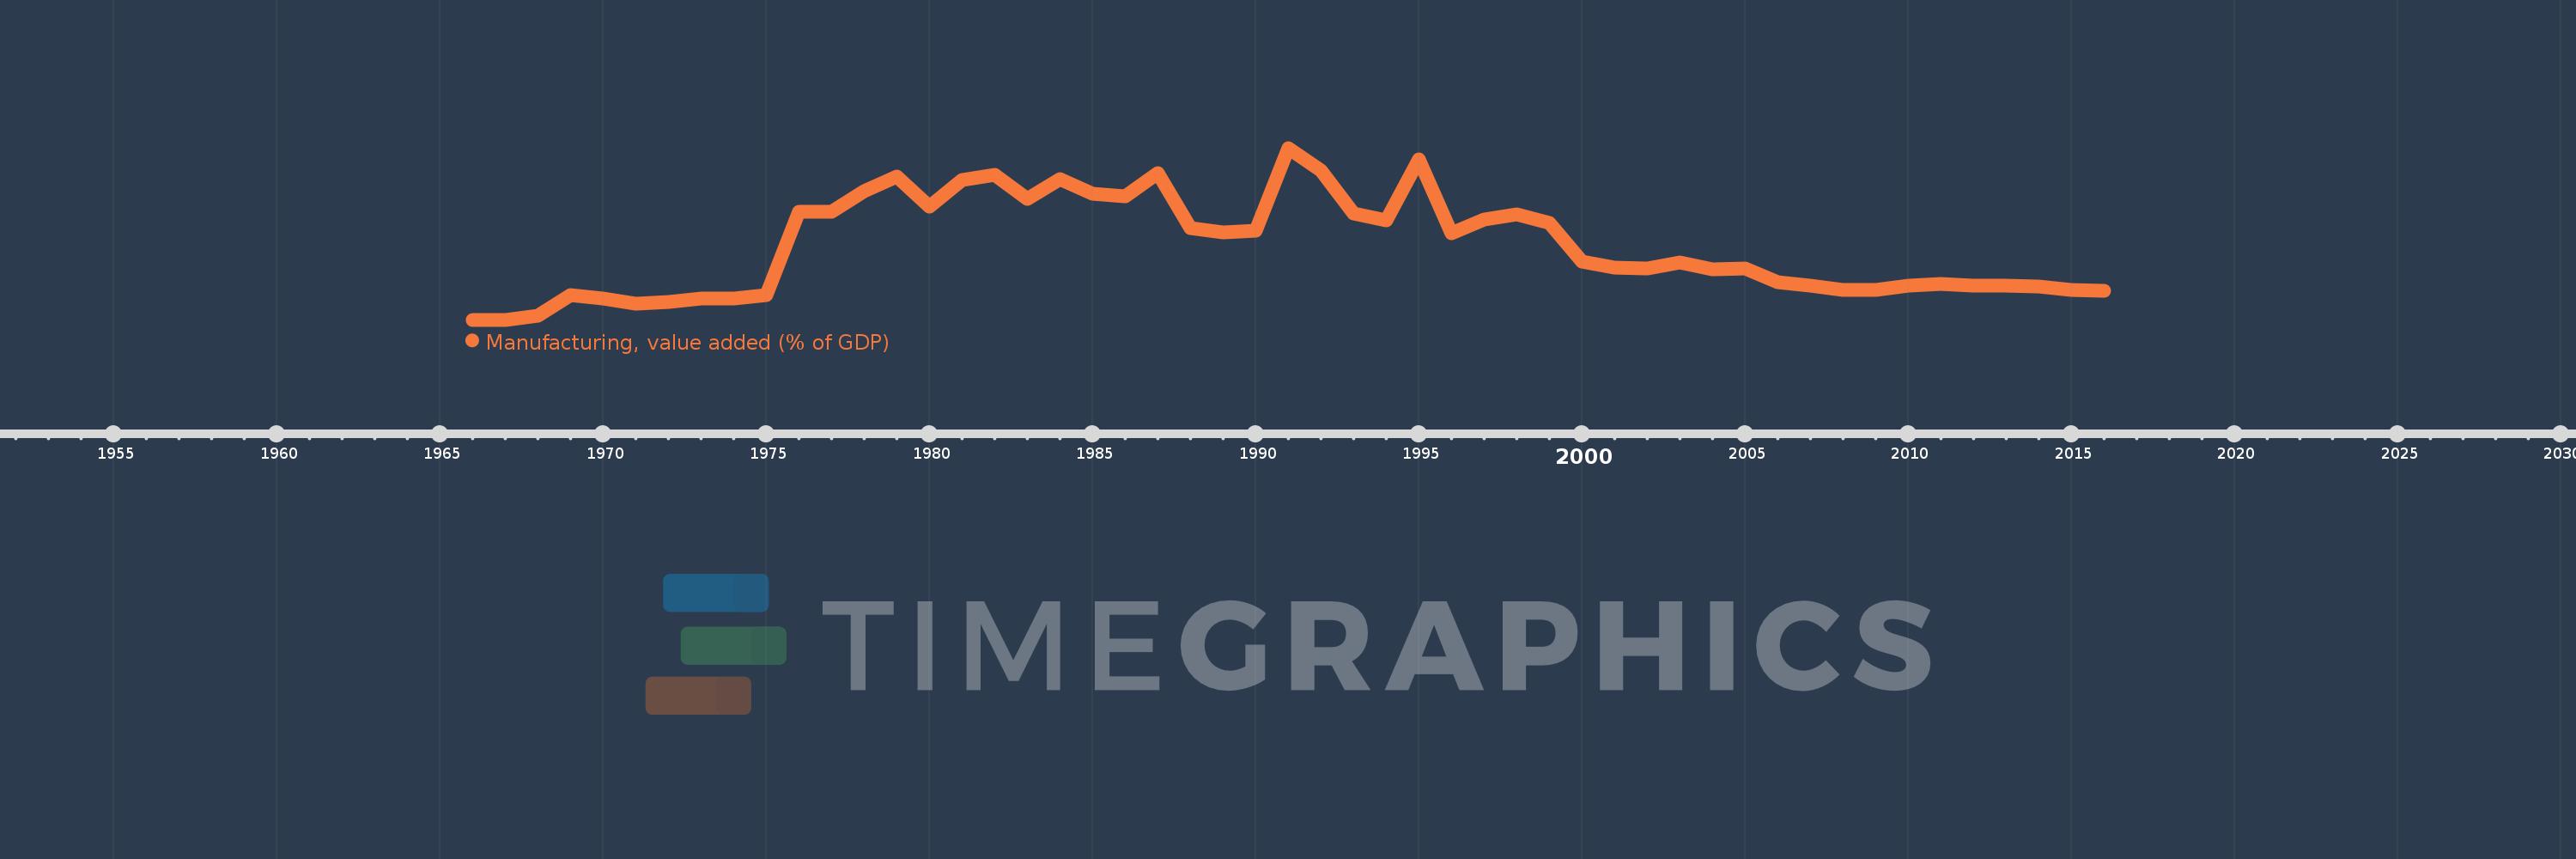
Manufacturing, value added (% of GDP)
2016,2015,2014,2013,2012,2011,2010,2009,2008,2007,2006,2005,2004,2003,2002,2001,2000,1999,1998,1997,1996,1995,1994,1993,1992,1991,1990,1989,1988,1987,1986,1985,1984,1983,1982,1981,1980,1979,1978,1977,1976,1975,1974,1973,1972,1971,1970,1969,1968,1967,1966
This statistics in other country:
AfghanistanAlbaniaAlgeriaAndorraAngolaAntigua and BarbudaArab WorldArgentinaArmeniaArubaAustraliaAustriaAzerbaijanBahamas, TheBahrainBangladeshBarbadosBelarusBelgiumBelizeBeninBermudaBhutanBoliviaBosnia and HerzegovinaBotswanaBrazilBrunei DarussalamBurkina FasoBurundiCabo VerdeCambodiaCameroonCanadaCaribbean small statesCayman IslandsCentral African RepublicCentral Europe and the BalticsChadChileChinaColombiaComorosCongo, Dem. Rep.Congo, Rep.Costa RicaCote d'IvoireCroatiaCubaCyprusCzech RepublicDenmarkDjiboutiDominicaDominican RepublicEarly-demographic dividendEast Asia & PacificEast Asia & Pacific (excluding high income)East Asia & Pacific (IDA & IBRD countries)EcuadorEgypt, Arab Rep.El SalvadorEquatorial GuineaEritreaEstoniaEthiopiaEuro areaEurope & Central AsiaEurope & Central Asia (excluding high income)Europe & Central Asia (IDA & IBRD countries)European UnionFaroe IslandsFijiFinlandFragile and conflict affected situationsFranceGabonGambia, TheGeorgiaGermanyGhanaGreeceGrenadaGuatemalaGuineaGuinea-BissauGuyanaHeavily indebted poor countries (HIPC)High incomeHondurasHong Kong SAR, ChinaHungaryIBRD onlyIcelandIDA & IBRD totalIDA blendIDA onlyIDA totalIndiaIndonesiaIran, Islamic Rep.IrelandItalyJamaicaJapanJordanKazakhstanKenyaKiribatiKorea, Rep.KosovoKuwaitKyrgyz RepublicLao PDRLate-demographic dividendLatin America & Caribbean Latin America & Caribbean (excluding high income)Latin America & the Caribbean (IDA & IBRD countries)LatviaLeast developed countries: UN classificationLebanonLesothoLibyaLithuaniaLow & middle incomeLow incomeLower middle incomeLuxembourgMacao SAR, ChinaMacedonia, FYRMadagascarMalawiMalaysiaMaldivesMaliMaltaMarshall IslandsMauritaniaMauritiusMexicoMicronesia, Fed. Sts.Middle East & North AfricaMiddle East & North Africa (excluding high income)Middle East & North Africa (IDA & IBRD countries)Middle incomeMoldovaMongoliaMontenegroMoroccoMozambiqueMyanmarNamibiaNepalNetherlandsNew CaledoniaNew ZealandNicaraguaNigerNigeriaNorth AmericaNorwayOECD membersOmanOther small statesPacific island small statesPakistanPalauPanamaPapua New GuineaParaguayPeruPhilippinesPolandPortugalPost-demographic dividendPre-demographic dividendPuerto RicoQatarRomaniaRussian FederationRwandaSao Tome and PrincipeSaudi ArabiaSenegalSerbiaSeychellesSierra LeoneSingaporeSlovak RepublicSloveniaSmall statesSolomon IslandsSomaliaSouth AfricaSouth AsiaSouth Asia (IDA & IBRD)SpainSri LankaSt. Kitts and NevisSt. LuciaSt. Vincent and the GrenadinesSub-Saharan Africa Sub-Saharan Africa (excluding high income)Sub-Saharan Africa (IDA & IBRD countries)SudanSurinameSwazilandSwedenSwitzerlandSyrian Arab RepublicTajikistanTanzaniaThailandTimor-LesteTogoTongaTrinidad and TobagoTunisiaTurkeyTurkmenistanTuvaluUgandaUkraineUnited KingdomUnited StatesUpper middle incomeUruguayUzbekistanVanuatuVenezuela, RBVietnamWest Bank and GazaWorldYemen, Rep.ZambiaZimbabwe Timeline:
This timeline shows a graph from 1966 to 2016 of Rwanda. No data until 1965. Number of actual observations by date: 51.
Source name:
World Development Indicators
Source organization:
World Bank national accounts data, and OECD National Accounts data files.
Categories, topics:
Economy & Growth
Last updated:
apr 23, 2017
Indicators value changes by year
Maximum:
18.305
jan 1, 1991
At the date of observation
Value
Absolute change
Change from previous value
jan 1, 1966
2.056
+2.056
0.0%
jan 1, 1967
2.058
+0.001
0.06%
jan 1, 1968
2.46
+0.402
19.55%
jan 1, 1969
4.366
+1.907
77.51%
jan 1, 1970
4.056
-0.31
-7.11%
jan 1, 1971
3.593
-0.464
-11.43%
jan 1, 1972
3.734
+0.141
3.93%
jan 1, 1973
4.097
+0.363
9.73%
jan 1, 1974
4.098
+0.001
0.04%
jan 1, 1975
4.358
+0.26
6.35%
jan 1, 1976
12.28
+7.921
181.75%
jan 1, 1977
12.284
+0.004
0.03%
jan 1, 1978
14.24
+1.956
15.92%
jan 1, 1979
15.595
+1.355
9.52%
jan 1, 1980
12.79
-2.805
-17.99%
jan 1, 1981
15.261
+2.471
19.32%
jan 1, 1982
15.737
+0.476
3.12%
jan 1, 1983
13.483
-2.254
-14.32%
jan 1, 1984
15.355
+1.872
13.88%
jan 1, 1985
13.955
-1.4
-9.12%
jan 1, 1986
13.722
-0.234
-1.67%
jan 1, 1987
15.928
+2.206
16.08%
jan 1, 1988
10.756
-5.172
-32.47%
jan 1, 1989
10.355
-0.401
-3.73%
jan 1, 1990
10.441
+0.086
0.83%
jan 1, 1991
18.305
+7.864
75.33%
jan 1, 1992
16.14
-2.165
-11.83%
jan 1, 1993
12.106
-4.034
-24.99%
jan 1, 1994
11.48
-0.626
-5.17%
jan 1, 1995
17.25
+5.77
50.26%
jan 1, 1996
10.22
-7.029
-40.75%
jan 1, 1997
11.545
+1.325
12.96%
jan 1, 1998
12.037
+0.492
4.26%
jan 1, 1999
11.235
-0.802
-6.66%
jan 1, 2000
7.535
-3.699
-32.93%
jan 1, 2001
6.969
-0.566
-7.51%
jan 1, 2002
6.908
-0.061
-0.87%
jan 1, 2003
7.487
+0.578
8.37%
jan 1, 2004
6.791
-0.696
-9.29%
jan 1, 2005
6.938
+0.147
2.17%
jan 1, 2006
5.625
-1.313
-18.92%
jan 1, 2007
5.303
-0.322
-5.72%
jan 1, 2008
4.843
-0.46
-8.68%
jan 1, 2009
4.88
+0.037
0.77%
jan 1, 2010
5.27
+0.39
8.0%
jan 1, 2011
5.447
+0.177
3.35%
jan 1, 2012
5.304
-0.143
-2.62%
jan 1, 2013
5.276
-0.028
-0.53%
jan 1, 2014
5.201
-0.075
-1.42%
jan 1, 2015
4.838
-0.364
-6.99%
jan 1, 2016
4.814
-0.024
-0.49%
Ranking of countries by current statistics by years


Comments: