29
/
en
AIzaSyAYiBZKx7MnpbEhh9jyipgxe19OcubqV5w
April 1, 2024
59981
Sub-Saharan Africa (excluding high income)
SSA
false
2
1
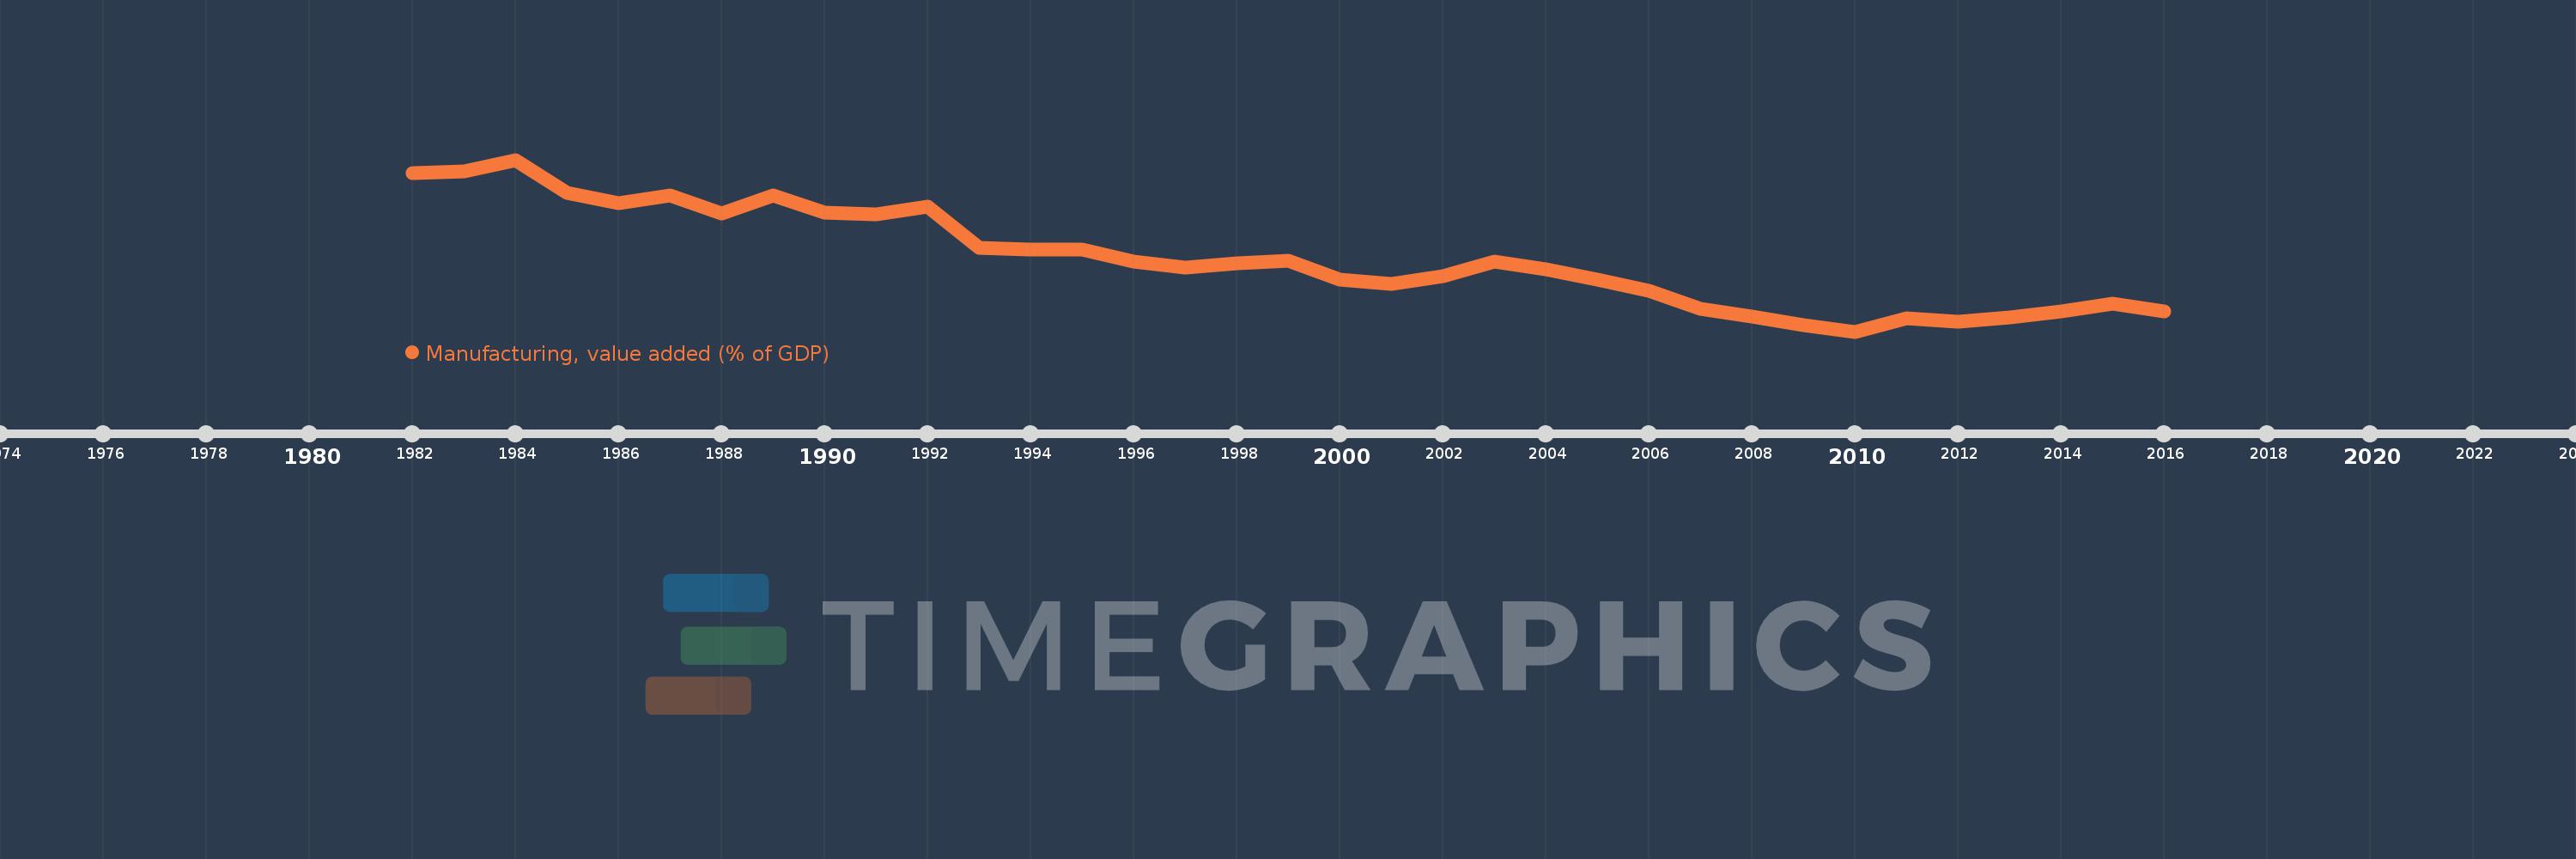
Manufacturing, value added (% of GDP)
2016,2015,2014,2013,2012,2011,2010,2009,2008,2007,2006,2005,2004,2003,2002,2001,2000,1999,1998,1997,1996,1995,1994,1993,1992,1991,1990,1989,1988,1987,1986,1985,1984,1983,1982
This statistics in other country:
AfghanistanAlbaniaAlgeriaAndorraAngolaAntigua and BarbudaArab WorldArgentinaArmeniaArubaAustraliaAustriaAzerbaijanBahamas, TheBahrainBangladeshBarbadosBelarusBelgiumBelizeBeninBermudaBhutanBoliviaBosnia and HerzegovinaBotswanaBrazilBrunei DarussalamBurkina FasoBurundiCabo VerdeCambodiaCameroonCanadaCaribbean small statesCayman IslandsCentral African RepublicCentral Europe and the BalticsChadChileChinaColombiaComorosCongo, Dem. Rep.Congo, Rep.Costa RicaCote d'IvoireCroatiaCubaCyprusCzech RepublicDenmarkDjiboutiDominicaDominican RepublicEarly-demographic dividendEast Asia & PacificEast Asia & Pacific (excluding high income)East Asia & Pacific (IDA & IBRD countries)EcuadorEgypt, Arab Rep.El SalvadorEquatorial GuineaEritreaEstoniaEthiopiaEuro areaEurope & Central AsiaEurope & Central Asia (excluding high income)Europe & Central Asia (IDA & IBRD countries)European UnionFaroe IslandsFijiFinlandFragile and conflict affected situationsFranceGabonGambia, TheGeorgiaGermanyGhanaGreeceGrenadaGuatemalaGuineaGuinea-BissauGuyanaHeavily indebted poor countries (HIPC)High incomeHondurasHong Kong SAR, ChinaHungaryIBRD onlyIcelandIDA & IBRD totalIDA blendIDA onlyIDA totalIndiaIndonesiaIran, Islamic Rep.IrelandItalyJamaicaJapanJordanKazakhstanKenyaKiribatiKorea, Rep.KosovoKuwaitKyrgyz RepublicLao PDRLate-demographic dividendLatin America & Caribbean Latin America & Caribbean (excluding high income)Latin America & the Caribbean (IDA & IBRD countries)LatviaLeast developed countries: UN classificationLebanonLesothoLibyaLithuaniaLow & middle incomeLow incomeLower middle incomeLuxembourgMacao SAR, ChinaMacedonia, FYRMadagascarMalawiMalaysiaMaldivesMaliMaltaMarshall IslandsMauritaniaMauritiusMexicoMicronesia, Fed. Sts.Middle East & North AfricaMiddle East & North Africa (excluding high income)Middle East & North Africa (IDA & IBRD countries)Middle incomeMoldovaMongoliaMontenegroMoroccoMozambiqueMyanmarNamibiaNepalNetherlandsNew CaledoniaNew ZealandNicaraguaNigerNigeriaNorth AmericaNorwayOECD membersOmanOther small statesPacific island small statesPakistanPalauPanamaPapua New GuineaParaguayPeruPhilippinesPolandPortugalPost-demographic dividendPre-demographic dividendPuerto RicoQatarRomaniaRussian FederationRwandaSao Tome and PrincipeSaudi ArabiaSenegalSerbiaSeychellesSierra LeoneSingaporeSlovak RepublicSloveniaSmall statesSolomon IslandsSomaliaSouth AfricaSouth AsiaSouth Asia (IDA & IBRD)SpainSri LankaSt. Kitts and NevisSt. LuciaSt. Vincent and the GrenadinesSub-Saharan Africa Sub-Saharan Africa (excluding high income)Sub-Saharan Africa (IDA & IBRD countries)SudanSurinameSwazilandSwedenSwitzerlandSyrian Arab RepublicTajikistanTanzaniaThailandTimor-LesteTogoTongaTrinidad and TobagoTunisiaTurkeyTurkmenistanTuvaluUgandaUkraineUnited KingdomUnited StatesUpper middle incomeUruguayUzbekistanVanuatuVenezuela, RBVietnamWest Bank and GazaWorldYemen, Rep.ZambiaZimbabwe Timeline:
This timeline shows a graph from 1982 to 2016 of Sub-Saharan Africa (excluding high income). No data until 1981. Number of actual observations by date: 35.
Source name:
World Development Indicators
Source organization:
World Bank national accounts data, and OECD National Accounts data files.
Categories, topics:
Economy & Growth
Last updated:
apr 23, 2017
Indicators value changes by year
Maximum:
15.271
jan 1, 1984
At the date of observation
Value
Absolute change
Change from previous value
jan 1, 1982
14.861
+14.861
0.0%
jan 1, 1983
14.906
+0.045
0.3%
jan 1, 1984
15.271
+0.365
2.45%
jan 1, 1985
14.234
-1.037
-6.79%
jan 1, 1986
13.929
-0.306
-2.15%
jan 1, 1987
14.165
+0.237
1.7%
jan 1, 1988
13.589
-0.577
-4.07%
jan 1, 1989
14.158
+0.57
4.19%
jan 1, 1990
13.614
-0.544
-3.84%
jan 1, 1991
13.571
-0.043
-0.31%
jan 1, 1992
13.811
+0.24
1.77%
jan 1, 1993
12.509
-1.302
-9.43%
jan 1, 1994
12.475
-0.034
-0.27%
jan 1, 1995
12.479
+0.004
0.03%
jan 1, 1996
12.1
-0.378
-3.03%
jan 1, 1997
11.91
-0.19
-1.57%
jan 1, 1998
12.033
+0.123
1.03%
jan 1, 1999
12.116
+0.083
0.69%
jan 1, 2000
11.54
-0.576
-4.75%
jan 1, 2001
11.383
-0.157
-1.36%
jan 1, 2002
11.65
+0.266
2.34%
jan 1, 2003
12.089
+0.439
3.77%
jan 1, 2004
11.839
-0.25
-2.07%
jan 1, 2005
11.525
-0.314
-2.65%
jan 1, 2006
11.179
-0.346
-3.0%
jan 1, 2007
10.609
-0.57
-5.1%
jan 1, 2008
10.365
-0.244
-2.3%
jan 1, 2009
10.111
-0.254
-2.45%
jan 1, 2010
9.907
-0.204
-2.02%
jan 1, 2011
10.314
+0.407
4.1%
jan 1, 2012
10.208
-0.105
-1.02%
jan 1, 2013
10.35
+0.142
1.39%
jan 1, 2014
10.529
+0.178
1.72%
jan 1, 2015
10.78
+0.252
2.39%
jan 1, 2016
10.54
-0.241
-2.23%
Ranking of countries by current statistics by years


Comments: