29
/
en
AIzaSyAYiBZKx7MnpbEhh9jyipgxe19OcubqV5w
April 1, 2024
43622
Latin America & the Caribbean (IDA & IBRD countries)
TLA
false
2
1
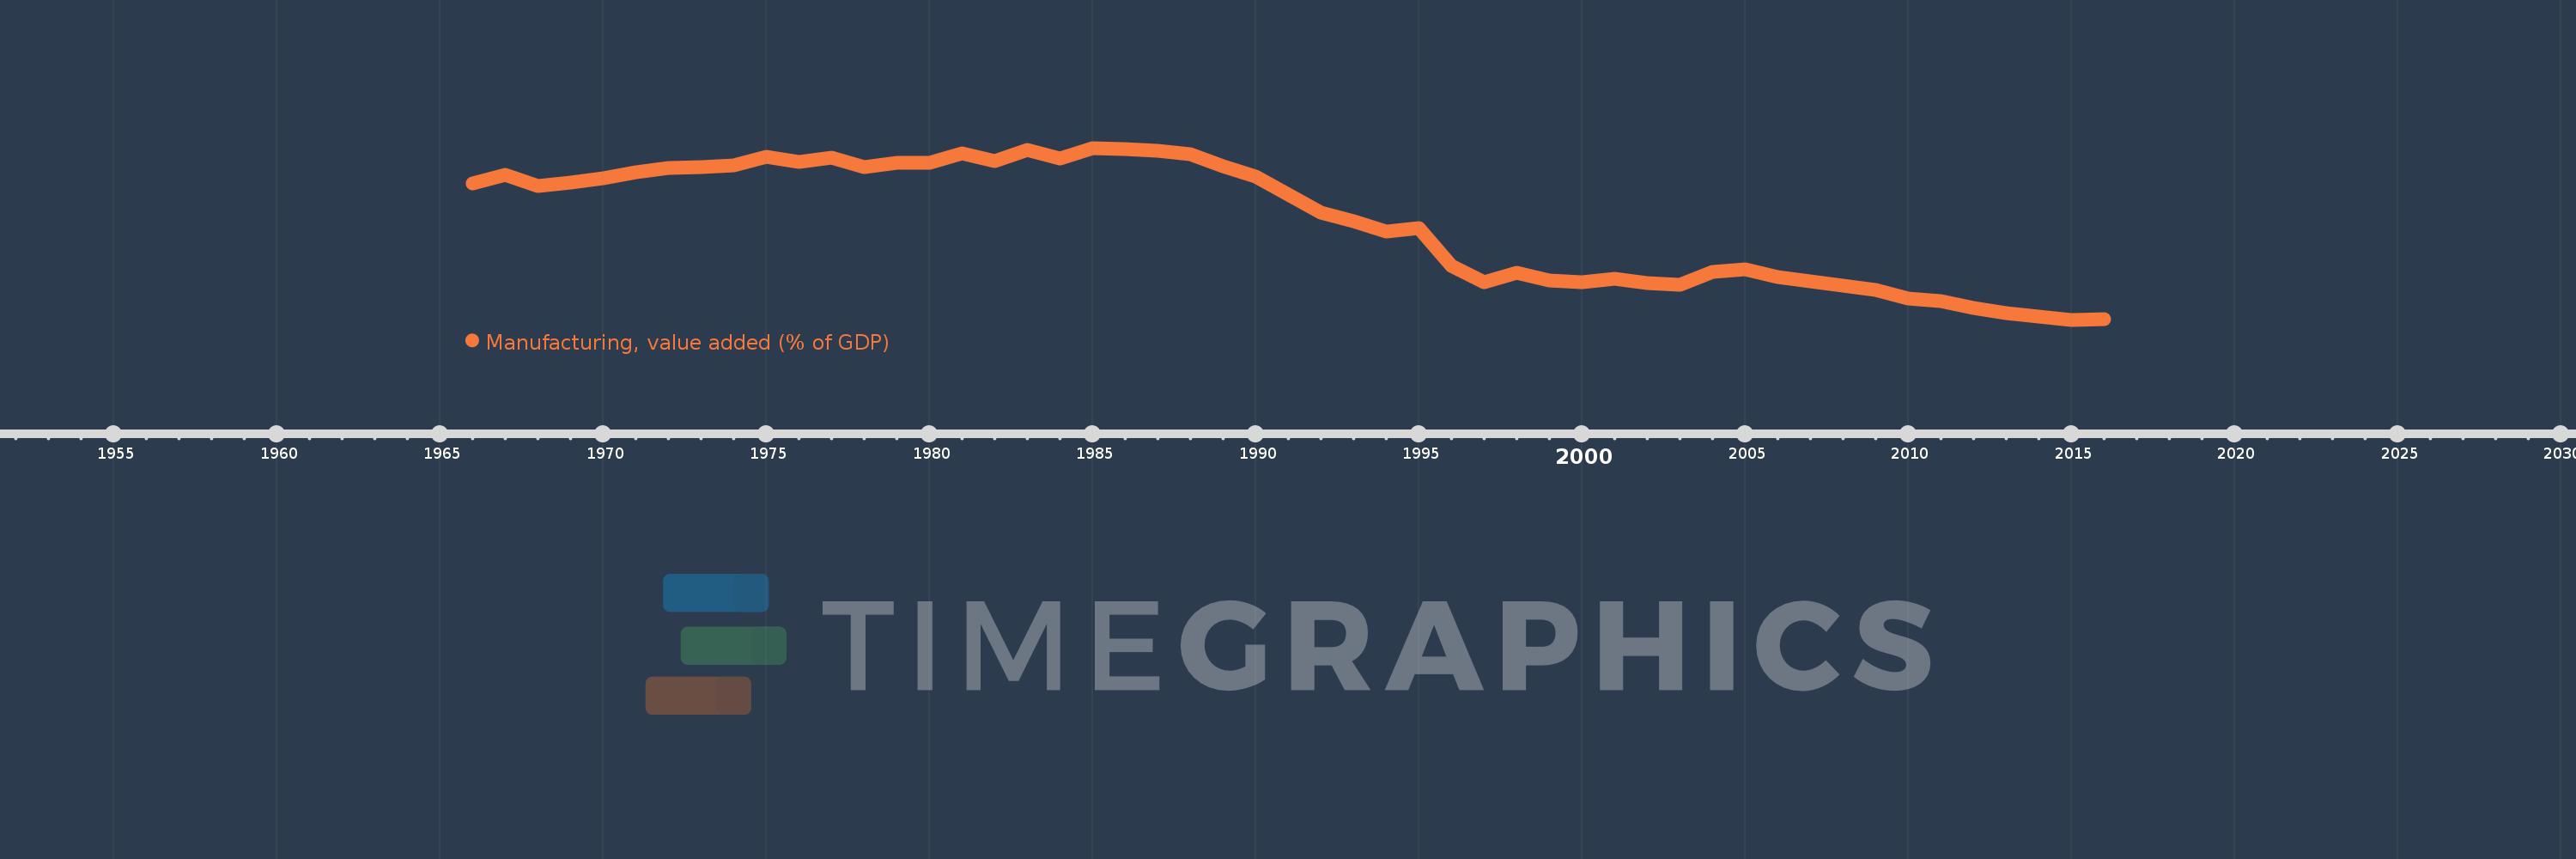
Manufacturing, value added (% of GDP)
2016,2015,2014,2013,2012,2011,2010,2009,2008,2007,2006,2005,2004,2003,2002,2001,2000,1999,1998,1997,1996,1995,1994,1993,1992,1990,1989,1988,1987,1986,1985,1984,1983,1982,1981,1980,1979,1978,1977,1976,1975,1974,1973,1972,1971,1970,1969,1968,1967,1966
This statistics in other country:
AfghanistanAlbaniaAlgeriaAndorraAngolaAntigua and BarbudaArab WorldArgentinaArmeniaArubaAustraliaAustriaAzerbaijanBahamas, TheBahrainBangladeshBarbadosBelarusBelgiumBelizeBeninBermudaBhutanBoliviaBosnia and HerzegovinaBotswanaBrazilBrunei DarussalamBurkina FasoBurundiCabo VerdeCambodiaCameroonCanadaCaribbean small statesCayman IslandsCentral African RepublicCentral Europe and the BalticsChadChileChinaColombiaComorosCongo, Dem. Rep.Congo, Rep.Costa RicaCote d'IvoireCroatiaCubaCyprusCzech RepublicDenmarkDjiboutiDominicaDominican RepublicEarly-demographic dividendEast Asia & PacificEast Asia & Pacific (excluding high income)East Asia & Pacific (IDA & IBRD countries)EcuadorEgypt, Arab Rep.El SalvadorEquatorial GuineaEritreaEstoniaEthiopiaEuro areaEurope & Central AsiaEurope & Central Asia (excluding high income)Europe & Central Asia (IDA & IBRD countries)European UnionFaroe IslandsFijiFinlandFragile and conflict affected situationsFranceGabonGambia, TheGeorgiaGermanyGhanaGreeceGrenadaGuatemalaGuineaGuinea-BissauGuyanaHeavily indebted poor countries (HIPC)High incomeHondurasHong Kong SAR, ChinaHungaryIBRD onlyIcelandIDA & IBRD totalIDA blendIDA onlyIDA totalIndiaIndonesiaIran, Islamic Rep.IrelandItalyJamaicaJapanJordanKazakhstanKenyaKiribatiKorea, Rep.KosovoKuwaitKyrgyz RepublicLao PDRLate-demographic dividendLatin America & Caribbean Latin America & Caribbean (excluding high income)Latin America & the Caribbean (IDA & IBRD countries)LatviaLeast developed countries: UN classificationLebanonLesothoLibyaLithuaniaLow & middle incomeLow incomeLower middle incomeLuxembourgMacao SAR, ChinaMacedonia, FYRMadagascarMalawiMalaysiaMaldivesMaliMaltaMarshall IslandsMauritaniaMauritiusMexicoMicronesia, Fed. Sts.Middle East & North AfricaMiddle East & North Africa (excluding high income)Middle East & North Africa (IDA & IBRD countries)Middle incomeMoldovaMongoliaMontenegroMoroccoMozambiqueMyanmarNamibiaNepalNetherlandsNew CaledoniaNew ZealandNicaraguaNigerNigeriaNorth AmericaNorwayOECD membersOmanOther small statesPacific island small statesPakistanPalauPanamaPapua New GuineaParaguayPeruPhilippinesPolandPortugalPost-demographic dividendPre-demographic dividendPuerto RicoQatarRomaniaRussian FederationRwandaSao Tome and PrincipeSaudi ArabiaSenegalSerbiaSeychellesSierra LeoneSingaporeSlovak RepublicSloveniaSmall statesSolomon IslandsSomaliaSouth AfricaSouth AsiaSouth Asia (IDA & IBRD)SpainSri LankaSt. Kitts and NevisSt. LuciaSt. Vincent and the GrenadinesSub-Saharan Africa Sub-Saharan Africa (excluding high income)Sub-Saharan Africa (IDA & IBRD countries)SudanSurinameSwazilandSwedenSwitzerlandSyrian Arab RepublicTajikistanTanzaniaThailandTimor-LesteTogoTongaTrinidad and TobagoTunisiaTurkeyTurkmenistanTuvaluUgandaUkraineUnited KingdomUnited StatesUpper middle incomeUruguayUzbekistanVanuatuVenezuela, RBVietnamWest Bank and GazaWorldYemen, Rep.ZambiaZimbabwe Timeline:
This timeline shows a graph from 1966 to 2016 of Latin America & the Caribbean (IDA & IBRD countries). No data until 1965. Number of actual observations by date: 50.
Source name:
World Development Indicators
Source organization:
World Bank national accounts data, and OECD National Accounts data files.
Categories, topics:
Economy & Growth
Last updated:
apr 23, 2017
Indicators value changes by year
Maximum:
27.711
jan 1, 1985
At the date of observation
Value
Absolute change
Change from previous value
jan 1, 1966
24.907
+24.907
0.0%
jan 1, 1967
25.53
+0.622
2.5%
jan 1, 1968
24.658
-0.872
-3.42%
jan 1, 1969
24.977
+0.319
1.29%
jan 1, 1970
25.316
+0.339
1.36%
jan 1, 1971
25.784
+0.468
1.85%
jan 1, 1972
26.116
+0.333
1.29%
jan 1, 1973
26.156
+0.04
0.15%
jan 1, 1974
26.352
+0.196
0.75%
jan 1, 1975
27.004
+0.652
2.47%
jan 1, 1976
26.59
-0.414
-1.53%
jan 1, 1977
26.915
+0.325
1.22%
jan 1, 1978
26.206
-0.709
-2.63%
jan 1, 1979
26.509
+0.303
1.15%
jan 1, 1980
26.53
+0.021
0.08%
jan 1, 1981
27.267
+0.737
2.78%
jan 1, 1982
26.682
-0.584
-2.14%
jan 1, 1983
27.521
+0.838
3.14%
jan 1, 1984
26.875
-0.646
-2.35%
jan 1, 1985
27.711
+0.836
3.11%
jan 1, 1986
27.623
-0.088
-0.32%
jan 1, 1987
27.494
-0.129
-0.47%
jan 1, 1988
27.223
-0.271
-0.99%
jan 1, 1989
26.258
-0.965
-3.55%
jan 1, 1990
25.4
-0.857
-3.27%
jan 1, 1992
22.541
-2.859
-11.26%
jan 1, 1993
21.834
-0.707
-3.14%
jan 1, 1994
21.038
-0.796
-3.65%
jan 1, 1995
21.344
+0.306
1.46%
jan 1, 1996
18.3
-3.044
-14.26%
jan 1, 1997
16.998
-1.302
-7.12%
jan 1, 1998
17.74
+0.742
4.36%
jan 1, 1999
17.146
-0.594
-3.35%
jan 1, 2000
16.961
-0.184
-1.08%
jan 1, 2001
17.236
+0.275
1.62%
jan 1, 2002
16.942
-0.294
-1.71%
jan 1, 2003
16.771
-0.17
-1.01%
jan 1, 2004
17.822
+1.05
6.26%
jan 1, 2005
18.036
+0.214
1.2%
jan 1, 2006
17.369
-0.667
-3.7%
jan 1, 2007
17.057
-0.312
-1.8%
jan 1, 2008
16.684
-0.373
-2.19%
jan 1, 2009
16.381
-0.303
-1.81%
jan 1, 2010
15.666
-0.715
-4.37%
jan 1, 2011
15.507
-0.158
-1.01%
jan 1, 2012
14.931
-0.577
-3.72%
jan 1, 2013
14.516
-0.414
-2.78%
jan 1, 2014
14.245
-0.271
-1.87%
jan 1, 2015
13.99
-0.256
-1.8%
jan 1, 2016
14.061
+0.071
0.51%
Ranking of countries by current statistics by years


Comments: