29
/
en
AIzaSyAYiBZKx7MnpbEhh9jyipgxe19OcubqV5w
April 1, 2024
60935
Sub-Saharan Africa (IDA & IBRD countries)
TSS
false
2
1
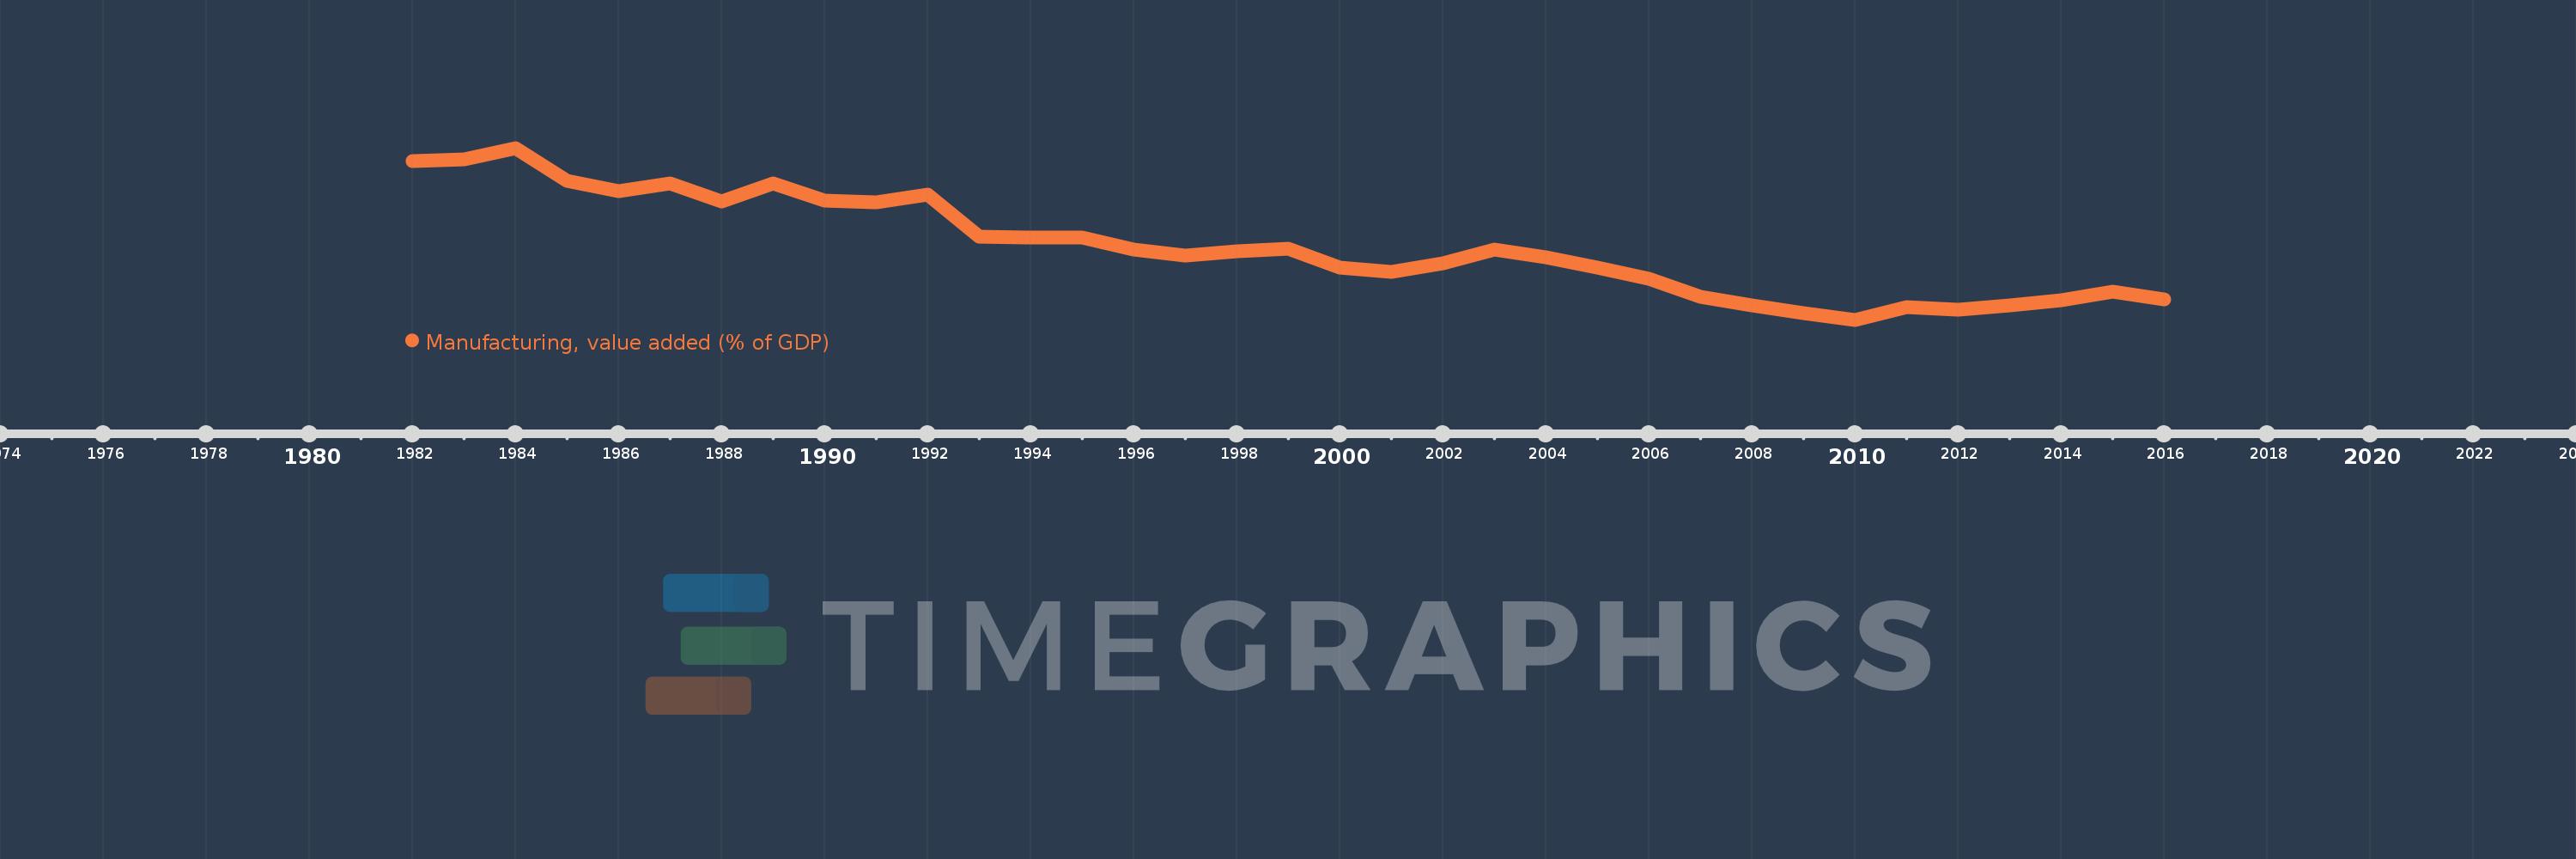
Manufacturing, value added (% of GDP)
2016,2015,2014,2013,2012,2011,2010,2009,2008,2007,2006,2005,2004,2003,2002,2001,2000,1999,1998,1997,1996,1995,1994,1993,1992,1991,1990,1989,1988,1987,1986,1985,1984,1983,1982
This statistics in other country:
AfghanistanAlbaniaAlgeriaAndorraAngolaAntigua and BarbudaArab WorldArgentinaArmeniaArubaAustraliaAustriaAzerbaijanBahamas, TheBahrainBangladeshBarbadosBelarusBelgiumBelizeBeninBermudaBhutanBoliviaBosnia and HerzegovinaBotswanaBrazilBrunei DarussalamBurkina FasoBurundiCabo VerdeCambodiaCameroonCanadaCaribbean small statesCayman IslandsCentral African RepublicCentral Europe and the BalticsChadChileChinaColombiaComorosCongo, Dem. Rep.Congo, Rep.Costa RicaCote d'IvoireCroatiaCubaCyprusCzech RepublicDenmarkDjiboutiDominicaDominican RepublicEarly-demographic dividendEast Asia & PacificEast Asia & Pacific (excluding high income)East Asia & Pacific (IDA & IBRD countries)EcuadorEgypt, Arab Rep.El SalvadorEquatorial GuineaEritreaEstoniaEthiopiaEuro areaEurope & Central AsiaEurope & Central Asia (excluding high income)Europe & Central Asia (IDA & IBRD countries)European UnionFaroe IslandsFijiFinlandFragile and conflict affected situationsFranceGabonGambia, TheGeorgiaGermanyGhanaGreeceGrenadaGuatemalaGuineaGuinea-BissauGuyanaHeavily indebted poor countries (HIPC)High incomeHondurasHong Kong SAR, ChinaHungaryIBRD onlyIcelandIDA & IBRD totalIDA blendIDA onlyIDA totalIndiaIndonesiaIran, Islamic Rep.IrelandItalyJamaicaJapanJordanKazakhstanKenyaKiribatiKorea, Rep.KosovoKuwaitKyrgyz RepublicLao PDRLate-demographic dividendLatin America & Caribbean Latin America & Caribbean (excluding high income)Latin America & the Caribbean (IDA & IBRD countries)LatviaLeast developed countries: UN classificationLebanonLesothoLibyaLithuaniaLow & middle incomeLow incomeLower middle incomeLuxembourgMacao SAR, ChinaMacedonia, FYRMadagascarMalawiMalaysiaMaldivesMaliMaltaMarshall IslandsMauritaniaMauritiusMexicoMicronesia, Fed. Sts.Middle East & North AfricaMiddle East & North Africa (excluding high income)Middle East & North Africa (IDA & IBRD countries)Middle incomeMoldovaMongoliaMontenegroMoroccoMozambiqueMyanmarNamibiaNepalNetherlandsNew CaledoniaNew ZealandNicaraguaNigerNigeriaNorth AmericaNorwayOECD membersOmanOther small statesPacific island small statesPakistanPalauPanamaPapua New GuineaParaguayPeruPhilippinesPolandPortugalPost-demographic dividendPre-demographic dividendPuerto RicoQatarRomaniaRussian FederationRwandaSao Tome and PrincipeSaudi ArabiaSenegalSerbiaSeychellesSierra LeoneSingaporeSlovak RepublicSloveniaSmall statesSolomon IslandsSomaliaSouth AfricaSouth AsiaSouth Asia (IDA & IBRD)SpainSri LankaSt. Kitts and NevisSt. LuciaSt. Vincent and the GrenadinesSub-Saharan Africa Sub-Saharan Africa (excluding high income)Sub-Saharan Africa (IDA & IBRD countries)SudanSurinameSwazilandSwedenSwitzerlandSyrian Arab RepublicTajikistanTanzaniaThailandTimor-LesteTogoTongaTrinidad and TobagoTunisiaTurkeyTurkmenistanTuvaluUgandaUkraineUnited KingdomUnited StatesUpper middle incomeUruguayUzbekistanVanuatuVenezuela, RBVietnamWest Bank and GazaWorldYemen, Rep.ZambiaZimbabwe Timeline:
This timeline shows a graph from 1982 to 2016 of Sub-Saharan Africa (IDA & IBRD countries). No data until 1981. Number of actual observations by date: 35.
Source name:
World Development Indicators
Source organization:
World Bank national accounts data, and OECD National Accounts data files.
Categories, topics:
Economy & Growth
Last updated:
apr 23, 2017
Indicators value changes by year
Maximum:
15.265
jan 1, 1984
At the date of observation
Value
Absolute change
Change from previous value
jan 1, 1982
14.855
+14.855
0.0%
jan 1, 1983
14.899
+0.045
0.3%
jan 1, 1984
15.265
+0.366
2.46%
jan 1, 1985
14.23
-1.036
-6.78%
jan 1, 1986
13.925
-0.305
-2.14%
jan 1, 1987
14.161
+0.236
1.7%
jan 1, 1988
13.585
-0.576
-4.07%
jan 1, 1989
14.155
+0.57
4.2%
jan 1, 1990
13.61
-0.545
-3.85%
jan 1, 1991
13.569
-0.042
-0.31%
jan 1, 1992
13.809
+0.24
1.77%
jan 1, 1993
12.508
-1.3
-9.42%
jan 1, 1994
12.473
-0.035
-0.28%
jan 1, 1995
12.478
+0.005
0.04%
jan 1, 1996
12.101
-0.377
-3.02%
jan 1, 1997
11.911
-0.19
-1.57%
jan 1, 1998
12.035
+0.124
1.04%
jan 1, 1999
12.118
+0.083
0.69%
jan 1, 2000
11.543
-0.576
-4.75%
jan 1, 2001
11.39
-0.153
-1.33%
jan 1, 2002
11.655
+0.265
2.33%
jan 1, 2003
12.094
+0.439
3.77%
jan 1, 2004
11.843
-0.252
-2.08%
jan 1, 2005
11.521
-0.322
-2.72%
jan 1, 2006
11.177
-0.344
-2.99%
jan 1, 2007
10.608
-0.569
-5.09%
jan 1, 2008
10.365
-0.243
-2.29%
jan 1, 2009
10.11
-0.254
-2.45%
jan 1, 2010
9.905
-0.205
-2.03%
jan 1, 2011
10.311
+0.406
4.1%
jan 1, 2012
10.206
-0.106
-1.03%
jan 1, 2013
10.348
+0.142
1.39%
jan 1, 2014
10.526
+0.178
1.72%
jan 1, 2015
10.777
+0.251
2.38%
jan 1, 2016
10.54
-0.237
-2.2%
Ranking of countries by current statistics by years


Comments: