29
/
en
AIzaSyAYiBZKx7MnpbEhh9jyipgxe19OcubqV5w
April 1, 2024
154874
India
IND
true
2
1
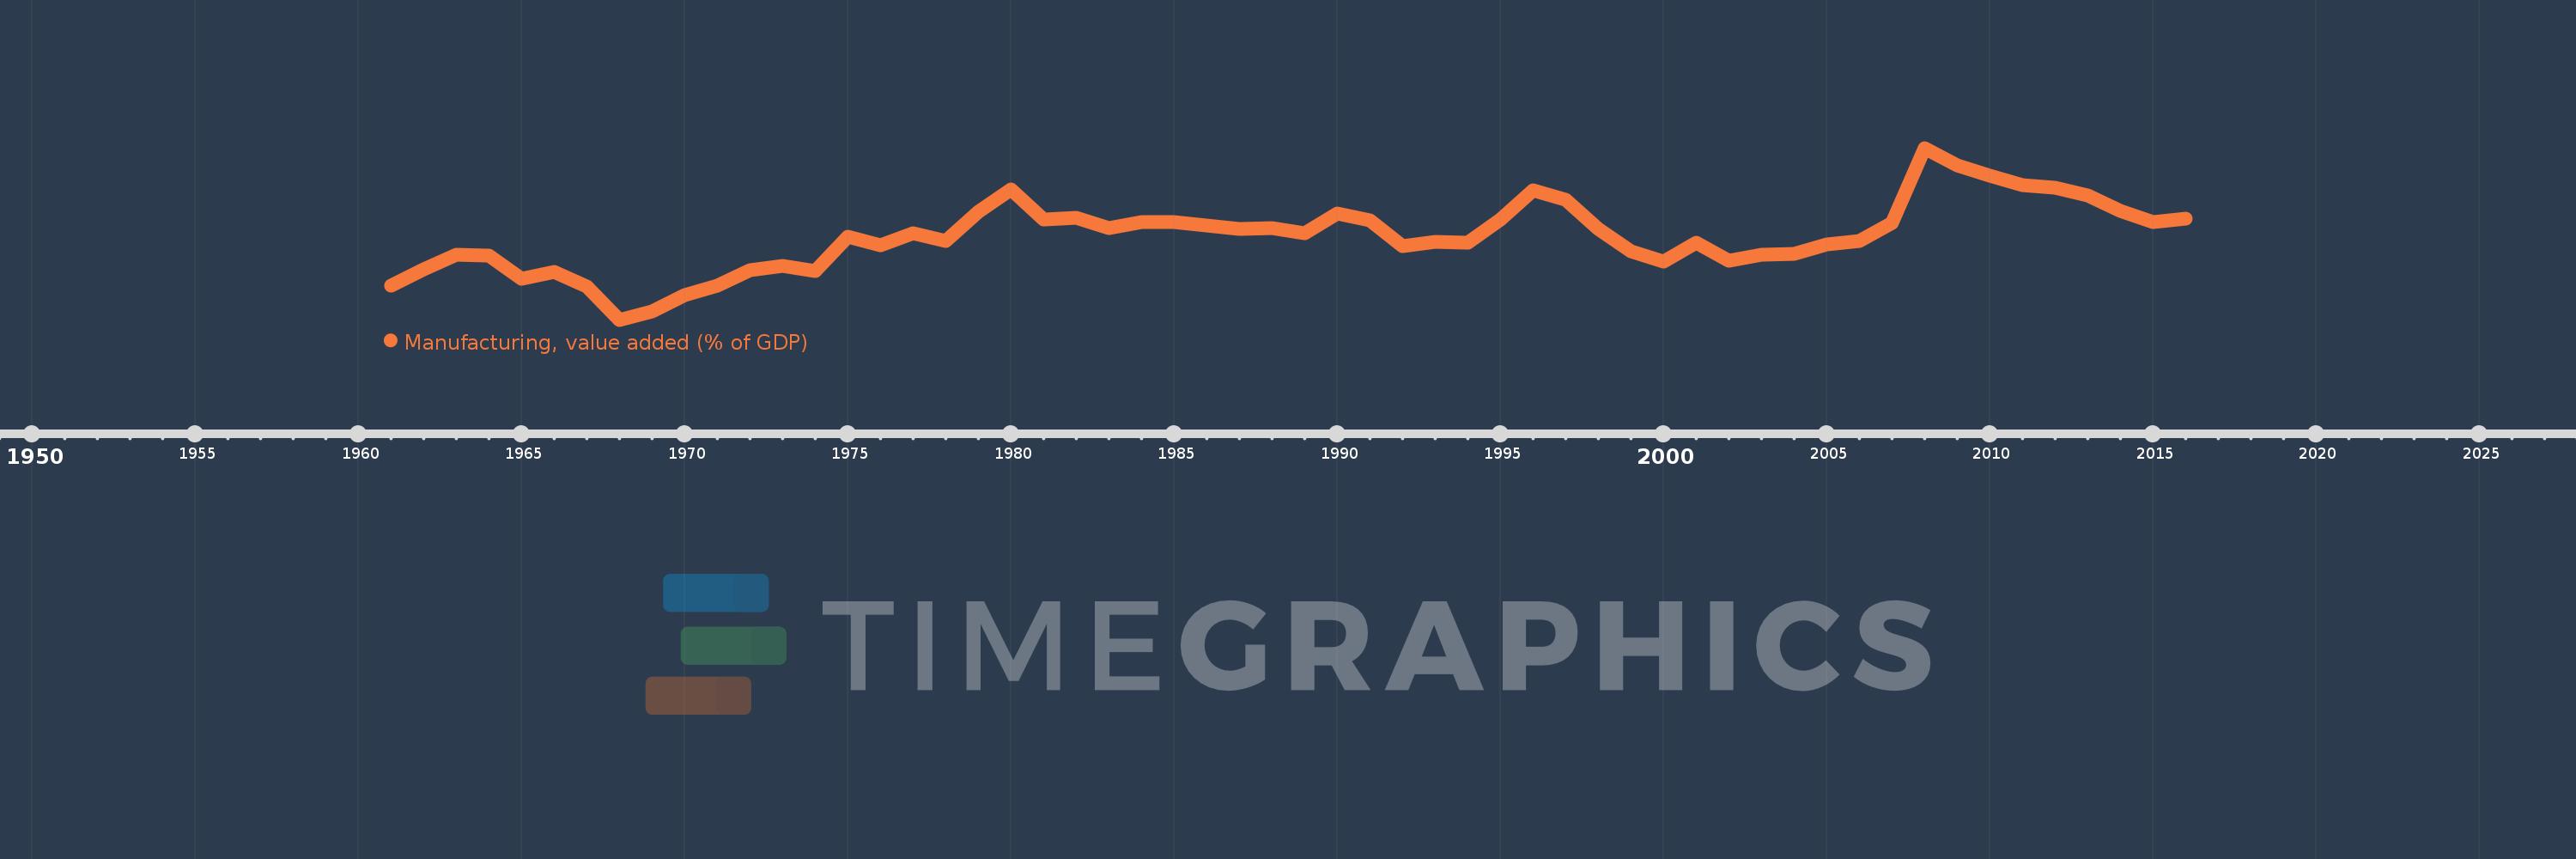
Manufacturing, value added (% of GDP)
2016,2015,2014,2013,2012,2011,2010,2009,2008,2007,2006,2005,2004,2003,2002,2001,2000,1999,1998,1997,1996,1995,1994,1993,1992,1991,1990,1989,1988,1987,1986,1985,1984,1983,1982,1981,1980,1979,1978,1977,1976,1975,1974,1973,1972,1971,1970,1969,1968,1967,1966,1965,1964,1963,1962,1961
This statistics in other country:
AfghanistanAlbaniaAlgeriaAndorraAngolaAntigua and BarbudaArab WorldArgentinaArmeniaArubaAustraliaAustriaAzerbaijanBahamas, TheBahrainBangladeshBarbadosBelarusBelgiumBelizeBeninBermudaBhutanBoliviaBosnia and HerzegovinaBotswanaBrazilBrunei DarussalamBurkina FasoBurundiCabo VerdeCambodiaCameroonCanadaCaribbean small statesCayman IslandsCentral African RepublicCentral Europe and the BalticsChadChileChinaColombiaComorosCongo, Dem. Rep.Congo, Rep.Costa RicaCote d'IvoireCroatiaCubaCyprusCzech RepublicDenmarkDjiboutiDominicaDominican RepublicEarly-demographic dividendEast Asia & PacificEast Asia & Pacific (excluding high income)East Asia & Pacific (IDA & IBRD countries)EcuadorEgypt, Arab Rep.El SalvadorEquatorial GuineaEritreaEstoniaEthiopiaEuro areaEurope & Central AsiaEurope & Central Asia (excluding high income)Europe & Central Asia (IDA & IBRD countries)European UnionFaroe IslandsFijiFinlandFragile and conflict affected situationsFranceGabonGambia, TheGeorgiaGermanyGhanaGreeceGrenadaGuatemalaGuineaGuinea-BissauGuyanaHeavily indebted poor countries (HIPC)High incomeHondurasHong Kong SAR, ChinaHungaryIBRD onlyIcelandIDA & IBRD totalIDA blendIDA onlyIDA totalIndiaIndonesiaIran, Islamic Rep.IrelandItalyJamaicaJapanJordanKazakhstanKenyaKiribatiKorea, Rep.KosovoKuwaitKyrgyz RepublicLao PDRLate-demographic dividendLatin America & Caribbean Latin America & Caribbean (excluding high income)Latin America & the Caribbean (IDA & IBRD countries)LatviaLeast developed countries: UN classificationLebanonLesothoLibyaLithuaniaLow & middle incomeLow incomeLower middle incomeLuxembourgMacao SAR, ChinaMacedonia, FYRMadagascarMalawiMalaysiaMaldivesMaliMaltaMarshall IslandsMauritaniaMauritiusMexicoMicronesia, Fed. Sts.Middle East & North AfricaMiddle East & North Africa (excluding high income)Middle East & North Africa (IDA & IBRD countries)Middle incomeMoldovaMongoliaMontenegroMoroccoMozambiqueMyanmarNamibiaNepalNetherlandsNew CaledoniaNew ZealandNicaraguaNigerNigeriaNorth AmericaNorwayOECD membersOmanOther small statesPacific island small statesPakistanPalauPanamaPapua New GuineaParaguayPeruPhilippinesPolandPortugalPost-demographic dividendPre-demographic dividendPuerto RicoQatarRomaniaRussian FederationRwandaSao Tome and PrincipeSaudi ArabiaSenegalSerbiaSeychellesSierra LeoneSingaporeSlovak RepublicSloveniaSmall statesSolomon IslandsSomaliaSouth AfricaSouth AsiaSouth Asia (IDA & IBRD)SpainSri LankaSt. Kitts and NevisSt. LuciaSt. Vincent and the GrenadinesSub-Saharan Africa Sub-Saharan Africa (excluding high income)Sub-Saharan Africa (IDA & IBRD countries)SudanSurinameSwazilandSwedenSwitzerlandSyrian Arab RepublicTajikistanTanzaniaThailandTimor-LesteTogoTongaTrinidad and TobagoTunisiaTurkeyTurkmenistanTuvaluUgandaUkraineUnited KingdomUnited StatesUpper middle incomeUruguayUzbekistanVanuatuVenezuela, RBVietnamWest Bank and GazaWorldYemen, Rep.ZambiaZimbabwe Timeline:
This timeline shows a graph from 1961 to 2016 of India. No data until 1960. Number of actual observations by date: 56.
Source name:
World Development Indicators
Source organization:
World Bank national accounts data, and OECD National Accounts data files.
Categories, topics:
Economy & Growth
Last updated:
apr 23, 2017
Indicators value changes by year
Minimum:
12.429
jan 1, 1968
Maximum:
18.881
jan 1, 2008
At the date of observation
Value
Absolute change
Change from previous value
jan 1, 1961
13.71
+13.71
0.0%
jan 1, 1962
14.328
+0.618
4.51%
jan 1, 1963
14.878
+0.55
3.84%
jan 1, 1964
14.847
-0.031
-0.21%
jan 1, 1965
13.975
-0.872
-5.87%
jan 1, 1966
14.225
+0.25
1.79%
jan 1, 1967
13.67
-0.555
-3.9%
jan 1, 1968
12.429
-1.242
-9.08%
jan 1, 1969
12.754
+0.325
2.61%
jan 1, 1970
13.358
+0.604
4.73%
jan 1, 1971
13.705
+0.347
2.6%
jan 1, 1972
14.291
+0.586
4.28%
jan 1, 1973
14.436
+0.144
1.01%
jan 1, 1974
14.254
-0.182
-1.26%
jan 1, 1975
15.562
+1.308
9.18%
jan 1, 1976
15.241
-0.321
-2.06%
jan 1, 1977
15.689
+0.448
2.94%
jan 1, 1978
15.398
-0.291
-1.86%
jan 1, 1979
16.498
+1.1
7.15%
jan 1, 1980
17.313
+0.815
4.94%
jan 1, 1981
16.18
-1.133
-6.54%
jan 1, 1982
16.253
+0.073
0.45%
jan 1, 1983
15.885
-0.369
-2.27%
jan 1, 1984
16.101
+0.216
1.36%
jan 1, 1985
16.106
+0.005
0.03%
jan 1, 1986
15.98
-0.126
-0.78%
jan 1, 1987
15.845
-0.136
-0.85%
jan 1, 1988
15.875
+0.03
0.19%
jan 1, 1989
15.678
-0.197
-1.24%
jan 1, 1990
16.413
+0.735
4.69%
jan 1, 1991
16.159
-0.254
-1.55%
jan 1, 1992
15.207
-0.951
-5.89%
jan 1, 1993
15.36
+0.153
1.0%
jan 1, 1994
15.318
-0.042
-0.27%
jan 1, 1995
16.204
+0.886
5.78%
jan 1, 1996
17.305
+1.101
6.79%
jan 1, 1997
16.944
-0.361
-2.09%
jan 1, 1998
15.847
-1.097
-6.47%
jan 1, 1999
15.004
-0.843
-5.32%
jan 1, 2000
14.598
-0.406
-2.71%
jan 1, 2001
15.309
+0.711
4.87%
jan 1, 2002
14.642
-0.667
-4.36%
jan 1, 2003
14.87
+0.228
1.56%
jan 1, 2004
14.898
+0.028
0.19%
jan 1, 2005
15.253
+0.355
2.38%
jan 1, 2006
15.386
+0.134
0.88%
jan 1, 2007
16.058
+0.672
4.37%
jan 1, 2008
18.881
+2.822
17.58%
jan 1, 2009
18.218
-0.663
-3.51%
jan 1, 2010
17.823
-0.395
-2.17%
jan 1, 2011
17.469
-0.354
-1.99%
jan 1, 2012
17.393
-0.076
-0.43%
jan 1, 2013
17.086
-0.307
-1.76%
jan 1, 2014
16.518
-0.568
-3.32%
jan 1, 2015
16.087
-0.431
-2.61%
jan 1, 2016
16.241
+0.154
0.96%
Ranking of countries by current statistics by years


Comments: