29
/
en
AIzaSyAYiBZKx7MnpbEhh9jyipgxe19OcubqV5w
April 1, 2024
259847
Tajikistan
TJK
true
2
1
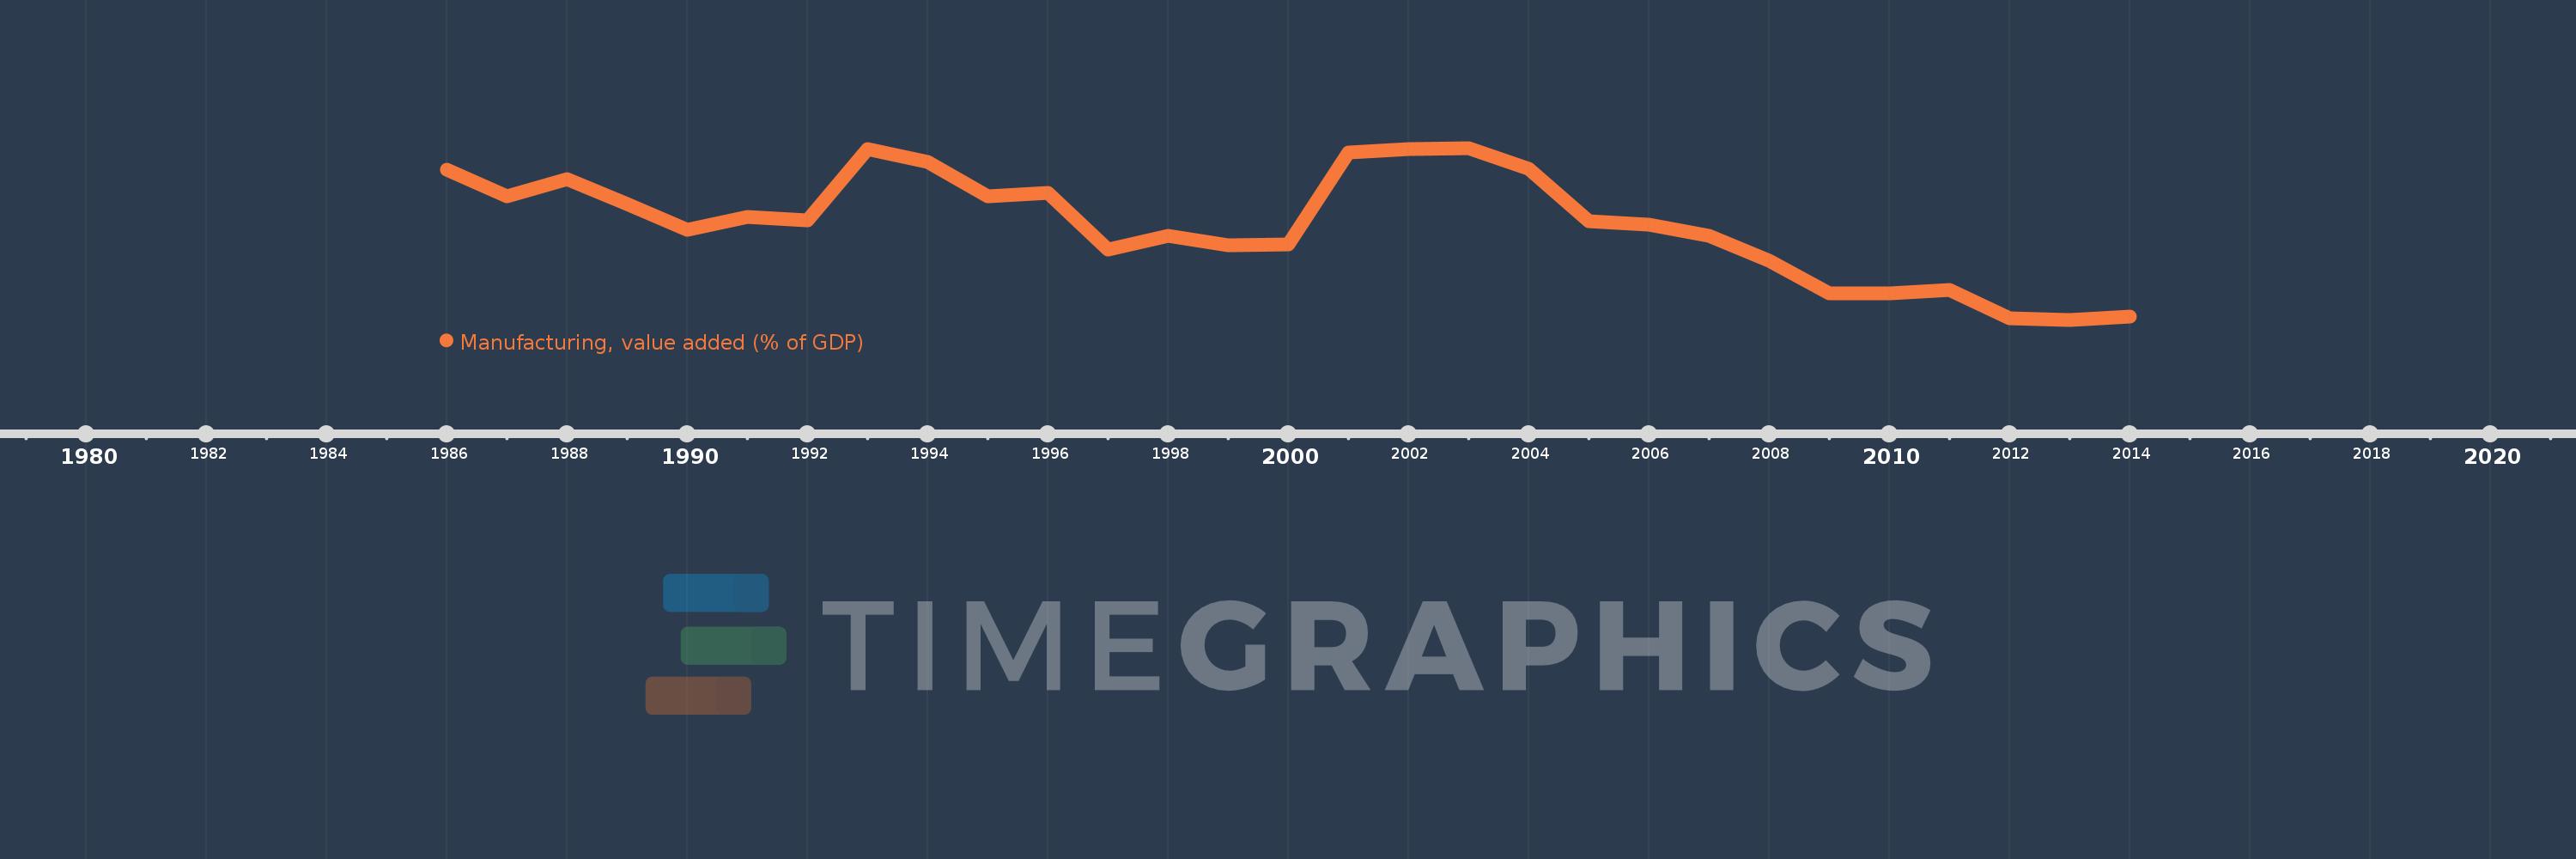
Manufacturing, value added (% of GDP)
2014,2013,2012,2011,2010,2009,2008,2007,2006,2005,2004,2003,2002,2001,2000,1999,1998,1997,1996,1995,1994,1993,1992,1991,1990,1989,1988,1987,1986
This statistics in other country:
AfghanistanAlbaniaAlgeriaAndorraAngolaAntigua and BarbudaArab WorldArgentinaArmeniaArubaAustraliaAustriaAzerbaijanBahamas, TheBahrainBangladeshBarbadosBelarusBelgiumBelizeBeninBermudaBhutanBoliviaBosnia and HerzegovinaBotswanaBrazilBrunei DarussalamBurkina FasoBurundiCabo VerdeCambodiaCameroonCanadaCaribbean small statesCayman IslandsCentral African RepublicCentral Europe and the BalticsChadChileChinaColombiaComorosCongo, Dem. Rep.Congo, Rep.Costa RicaCote d'IvoireCroatiaCubaCyprusCzech RepublicDenmarkDjiboutiDominicaDominican RepublicEarly-demographic dividendEast Asia & PacificEast Asia & Pacific (excluding high income)East Asia & Pacific (IDA & IBRD countries)EcuadorEgypt, Arab Rep.El SalvadorEquatorial GuineaEritreaEstoniaEthiopiaEuro areaEurope & Central AsiaEurope & Central Asia (excluding high income)Europe & Central Asia (IDA & IBRD countries)European UnionFaroe IslandsFijiFinlandFragile and conflict affected situationsFranceGabonGambia, TheGeorgiaGermanyGhanaGreeceGrenadaGuatemalaGuineaGuinea-BissauGuyanaHeavily indebted poor countries (HIPC)High incomeHondurasHong Kong SAR, ChinaHungaryIBRD onlyIcelandIDA & IBRD totalIDA blendIDA onlyIDA totalIndiaIndonesiaIran, Islamic Rep.IrelandItalyJamaicaJapanJordanKazakhstanKenyaKiribatiKorea, Rep.KosovoKuwaitKyrgyz RepublicLao PDRLate-demographic dividendLatin America & Caribbean Latin America & Caribbean (excluding high income)Latin America & the Caribbean (IDA & IBRD countries)LatviaLeast developed countries: UN classificationLebanonLesothoLibyaLithuaniaLow & middle incomeLow incomeLower middle incomeLuxembourgMacao SAR, ChinaMacedonia, FYRMadagascarMalawiMalaysiaMaldivesMaliMaltaMarshall IslandsMauritaniaMauritiusMexicoMicronesia, Fed. Sts.Middle East & North AfricaMiddle East & North Africa (excluding high income)Middle East & North Africa (IDA & IBRD countries)Middle incomeMoldovaMongoliaMontenegroMoroccoMozambiqueMyanmarNamibiaNepalNetherlandsNew CaledoniaNew ZealandNicaraguaNigerNigeriaNorth AmericaNorwayOECD membersOmanOther small statesPacific island small statesPakistanPalauPanamaPapua New GuineaParaguayPeruPhilippinesPolandPortugalPost-demographic dividendPre-demographic dividendPuerto RicoQatarRomaniaRussian FederationRwandaSao Tome and PrincipeSaudi ArabiaSenegalSerbiaSeychellesSierra LeoneSingaporeSlovak RepublicSloveniaSmall statesSolomon IslandsSomaliaSouth AfricaSouth AsiaSouth Asia (IDA & IBRD)SpainSri LankaSt. Kitts and NevisSt. LuciaSt. Vincent and the GrenadinesSub-Saharan Africa Sub-Saharan Africa (excluding high income)Sub-Saharan Africa (IDA & IBRD countries)SudanSurinameSwazilandSwedenSwitzerlandSyrian Arab RepublicTajikistanTanzaniaThailandTimor-LesteTogoTongaTrinidad and TobagoTunisiaTurkeyTurkmenistanTuvaluUgandaUkraineUnited KingdomUnited StatesUpper middle incomeUruguayUzbekistanVanuatuVenezuela, RBVietnamWest Bank and GazaWorldYemen, Rep.ZambiaZimbabwe Timeline:
This timeline shows a graph from 1986 to 2014 of Tajikistan. No data until 1985. Number of actual observations by date: 29.
Source name:
World Development Indicators
Source organization:
World Bank national accounts data, and OECD National Accounts data files.
Categories, topics:
Economy & Growth
Last updated:
apr 23, 2017
Indicators value changes by year
Minimum:
10.802
jan 1, 2013
Maximum:
34.244
jan 1, 2003
At the date of observation
Value
Absolute change
Change from previous value
jan 1, 1986
31.323
+31.323
0.0%
jan 1, 1987
27.656
-3.667
-11.71%
jan 1, 1988
30.0
+2.344
8.48%
jan 1, 1989
26.599
-3.401
-11.34%
jan 1, 1990
23.043
-3.555
-13.37%
jan 1, 1991
24.829
+1.785
7.75%
jan 1, 1992
24.399
-0.429
-1.73%
jan 1, 1993
34.075
+9.675
39.65%
jan 1, 1994
32.371
-1.704
-5.0%
jan 1, 1995
27.697
-4.674
-14.44%
jan 1, 1996
28.112
+0.415
1.5%
jan 1, 1997
20.384
-7.729
-27.49%
jan 1, 1998
22.311
+1.928
9.46%
jan 1, 1999
20.915
-1.396
-6.26%
jan 1, 2000
21.132
+0.218
1.04%
jan 1, 2001
33.657
+12.525
59.27%
jan 1, 2002
34.123
+0.466
1.38%
jan 1, 2003
34.244
+0.121
0.35%
jan 1, 2004
31.347
-2.897
-8.46%
jan 1, 2005
24.287
-7.061
-22.52%
jan 1, 2006
23.724
-0.563
-2.32%
jan 1, 2007
22.209
-1.515
-6.39%
jan 1, 2008
18.847
-3.362
-15.14%
jan 1, 2009
14.424
-4.423
-23.47%
jan 1, 2010
14.389
-0.036
-0.25%
jan 1, 2011
14.885
+0.496
3.45%
jan 1, 2012
11.03
-3.855
-25.9%
jan 1, 2013
10.802
-0.228
-2.07%
jan 1, 2014
11.187
+0.385
3.56%
Ranking of countries by current statistics by years


Comments: