29
/
en
AIzaSyAYiBZKx7MnpbEhh9jyipgxe19OcubqV5w
April 1, 2024
216694
Pakistan
PAK
true
2
1
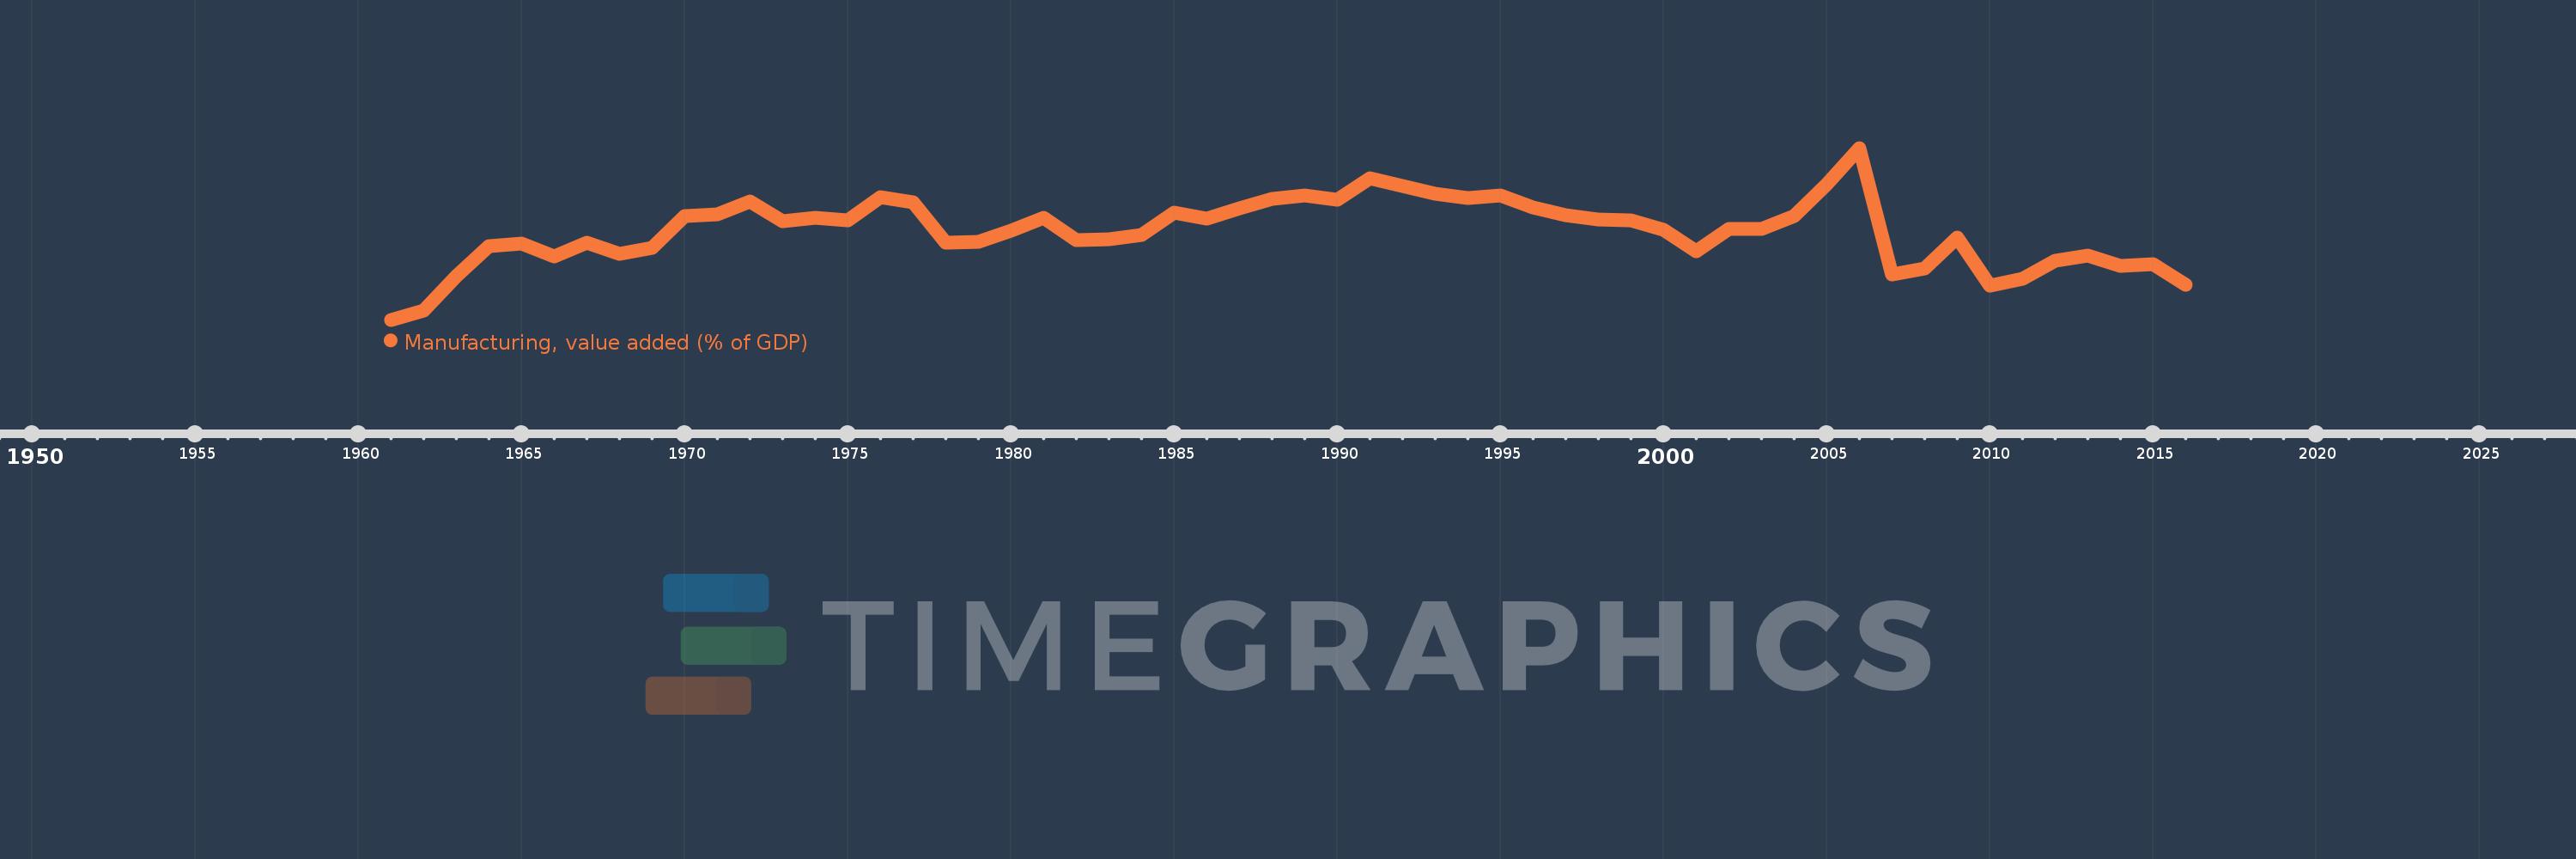
Manufacturing, value added (% of GDP)
2016,2015,2014,2013,2012,2011,2010,2009,2008,2007,2006,2005,2004,2003,2002,2001,2000,1999,1998,1997,1996,1995,1994,1993,1992,1991,1990,1989,1988,1987,1986,1985,1984,1983,1982,1981,1980,1979,1978,1977,1976,1975,1974,1973,1972,1971,1970,1969,1968,1967,1966,1965,1964,1963,1962,1961
This statistics in other country:
AfghanistanAlbaniaAlgeriaAndorraAngolaAntigua and BarbudaArab WorldArgentinaArmeniaArubaAustraliaAustriaAzerbaijanBahamas, TheBahrainBangladeshBarbadosBelarusBelgiumBelizeBeninBermudaBhutanBoliviaBosnia and HerzegovinaBotswanaBrazilBrunei DarussalamBurkina FasoBurundiCabo VerdeCambodiaCameroonCanadaCaribbean small statesCayman IslandsCentral African RepublicCentral Europe and the BalticsChadChileChinaColombiaComorosCongo, Dem. Rep.Congo, Rep.Costa RicaCote d'IvoireCroatiaCubaCyprusCzech RepublicDenmarkDjiboutiDominicaDominican RepublicEarly-demographic dividendEast Asia & PacificEast Asia & Pacific (excluding high income)East Asia & Pacific (IDA & IBRD countries)EcuadorEgypt, Arab Rep.El SalvadorEquatorial GuineaEritreaEstoniaEthiopiaEuro areaEurope & Central AsiaEurope & Central Asia (excluding high income)Europe & Central Asia (IDA & IBRD countries)European UnionFaroe IslandsFijiFinlandFragile and conflict affected situationsFranceGabonGambia, TheGeorgiaGermanyGhanaGreeceGrenadaGuatemalaGuineaGuinea-BissauGuyanaHeavily indebted poor countries (HIPC)High incomeHondurasHong Kong SAR, ChinaHungaryIBRD onlyIcelandIDA & IBRD totalIDA blendIDA onlyIDA totalIndiaIndonesiaIran, Islamic Rep.IrelandItalyJamaicaJapanJordanKazakhstanKenyaKiribatiKorea, Rep.KosovoKuwaitKyrgyz RepublicLao PDRLate-demographic dividendLatin America & Caribbean Latin America & Caribbean (excluding high income)Latin America & the Caribbean (IDA & IBRD countries)LatviaLeast developed countries: UN classificationLebanonLesothoLibyaLithuaniaLow & middle incomeLow incomeLower middle incomeLuxembourgMacao SAR, ChinaMacedonia, FYRMadagascarMalawiMalaysiaMaldivesMaliMaltaMarshall IslandsMauritaniaMauritiusMexicoMicronesia, Fed. Sts.Middle East & North AfricaMiddle East & North Africa (excluding high income)Middle East & North Africa (IDA & IBRD countries)Middle incomeMoldovaMongoliaMontenegroMoroccoMozambiqueMyanmarNamibiaNepalNetherlandsNew CaledoniaNew ZealandNicaraguaNigerNigeriaNorth AmericaNorwayOECD membersOmanOther small statesPacific island small statesPakistanPalauPanamaPapua New GuineaParaguayPeruPhilippinesPolandPortugalPost-demographic dividendPre-demographic dividendPuerto RicoQatarRomaniaRussian FederationRwandaSao Tome and PrincipeSaudi ArabiaSenegalSerbiaSeychellesSierra LeoneSingaporeSlovak RepublicSloveniaSmall statesSolomon IslandsSomaliaSouth AfricaSouth AsiaSouth Asia (IDA & IBRD)SpainSri LankaSt. Kitts and NevisSt. LuciaSt. Vincent and the GrenadinesSub-Saharan Africa Sub-Saharan Africa (excluding high income)Sub-Saharan Africa (IDA & IBRD countries)SudanSurinameSwazilandSwedenSwitzerlandSyrian Arab RepublicTajikistanTanzaniaThailandTimor-LesteTogoTongaTrinidad and TobagoTunisiaTurkeyTurkmenistanTuvaluUgandaUkraineUnited KingdomUnited StatesUpper middle incomeUruguayUzbekistanVanuatuVenezuela, RBVietnamWest Bank and GazaWorldYemen, Rep.ZambiaZimbabwe Timeline:
This timeline shows a graph from 1961 to 2016 of Pakistan. No data until 1960. Number of actual observations by date: 56.
Source name:
World Development Indicators
Source organization:
World Bank national accounts data, and OECD National Accounts data files.
Categories, topics:
Economy & Growth
Last updated:
apr 23, 2017
Indicators value changes by year
Minimum:
12.096
jan 1, 1961
Maximum:
18.565
jan 1, 2006
At the date of observation
Value
Absolute change
Change from previous value
jan 1, 1961
12.096
+12.096
0.0%
jan 1, 1962
12.428
+0.332
2.74%
jan 1, 1963
13.724
+1.296
10.43%
jan 1, 1964
14.88
+1.157
8.43%
jan 1, 1965
14.966
+0.085
0.57%
jan 1, 1966
14.486
-0.48
-3.21%
jan 1, 1967
15.01
+0.524
3.62%
jan 1, 1968
14.582
-0.428
-2.85%
jan 1, 1969
14.789
+0.208
1.42%
jan 1, 1970
16.013
+1.224
8.28%
jan 1, 1971
16.064
+0.051
0.32%
jan 1, 1972
16.564
+0.5
3.11%
jan 1, 1973
15.809
-0.755
-4.56%
jan 1, 1974
15.947
+0.138
0.87%
jan 1, 1975
15.851
-0.096
-0.6%
jan 1, 1976
16.704
+0.853
5.38%
jan 1, 1977
16.516
-0.188
-1.13%
jan 1, 1978
14.994
-1.522
-9.21%
jan 1, 1979
15.021
+0.028
0.18%
jan 1, 1980
15.437
+0.416
2.77%
jan 1, 1981
15.932
+0.495
3.21%
jan 1, 1982
15.109
-0.822
-5.16%
jan 1, 1983
15.128
+0.019
0.12%
jan 1, 1984
15.286
+0.158
1.04%
jan 1, 1985
16.135
+0.849
5.55%
jan 1, 1986
15.903
-0.231
-1.43%
jan 1, 1987
16.276
+0.373
2.34%
jan 1, 1988
16.646
+0.37
2.27%
jan 1, 1989
16.788
+0.142
0.85%
jan 1, 1990
16.615
-0.173
-1.03%
jan 1, 1991
17.411
+0.797
4.8%
jan 1, 1992
17.133
-0.279
-1.6%
jan 1, 1993
16.856
-0.277
-1.62%
jan 1, 1994
16.675
-0.181
-1.07%
jan 1, 1995
16.781
+0.106
0.64%
jan 1, 1996
16.313
-0.468
-2.79%
jan 1, 1997
16.048
-0.265
-1.63%
jan 1, 1998
15.88
-0.169
-1.05%
jan 1, 1999
15.847
-0.032
-0.2%
jan 1, 2000
15.48
-0.367
-2.32%
jan 1, 2001
14.677
-0.803
-5.19%
jan 1, 2002
15.501
+0.824
5.61%
jan 1, 2003
15.505
+0.004
0.03%
jan 1, 2004
15.999
+0.494
3.19%
jan 1, 2005
17.188
+1.189
7.43%
jan 1, 2006
18.565
+1.376
8.01%
jan 1, 2007
13.807
-4.758
-25.63%
jan 1, 2008
14.034
+0.227
1.65%
jan 1, 2009
15.189
+1.155
8.23%
jan 1, 2010
13.387
-1.802
-11.86%
jan 1, 2011
13.642
+0.255
1.91%
jan 1, 2012
14.323
+0.681
4.99%
jan 1, 2013
14.512
+0.189
1.32%
jan 1, 2014
14.125
-0.387
-2.67%
jan 1, 2015
14.185
+0.06
0.43%
jan 1, 2016
13.416
-0.768
-5.42%
Ranking of countries by current statistics by years


Comments: