29
/
en
AIzaSyAYiBZKx7MnpbEhh9jyipgxe19OcubqV5w
April 1, 2024
244734
Somalia
SOM
true
2
1
Manufacturing, value added (% of GDP)
1991,1990,1989,1988,1987,1986,1985,1984,1983,1982,1981,1980,1979,1978,1977,1976,1975,1974,1973,1972,1971,1970,1969,1968,1967,1966,1965,1964,1963,1962,1961
This statistics in other country:
AfghanistanAlbaniaAlgeriaAndorraAngolaAntigua and BarbudaArab WorldArgentinaArmeniaArubaAustraliaAustriaAzerbaijanBahamas, TheBahrainBangladeshBarbadosBelarusBelgiumBelizeBeninBermudaBhutanBoliviaBosnia and HerzegovinaBotswanaBrazilBrunei DarussalamBurkina FasoBurundiCabo VerdeCambodiaCameroonCanadaCaribbean small statesCayman IslandsCentral African RepublicCentral Europe and the BalticsChadChileChinaColombiaComorosCongo, Dem. Rep.Congo, Rep.Costa RicaCote d'IvoireCroatiaCubaCyprusCzech RepublicDenmarkDjiboutiDominicaDominican RepublicEarly-demographic dividendEast Asia & PacificEast Asia & Pacific (excluding high income)East Asia & Pacific (IDA & IBRD countries)EcuadorEgypt, Arab Rep.El SalvadorEquatorial GuineaEritreaEstoniaEthiopiaEuro areaEurope & Central AsiaEurope & Central Asia (excluding high income)Europe & Central Asia (IDA & IBRD countries)European UnionFaroe IslandsFijiFinlandFragile and conflict affected situationsFranceGabonGambia, TheGeorgiaGermanyGhanaGreeceGrenadaGuatemalaGuineaGuinea-BissauGuyanaHeavily indebted poor countries (HIPC)High incomeHondurasHong Kong SAR, ChinaHungaryIBRD onlyIcelandIDA & IBRD totalIDA blendIDA onlyIDA totalIndiaIndonesiaIran, Islamic Rep.IrelandItalyJamaicaJapanJordanKazakhstanKenyaKiribatiKorea, Rep.KosovoKuwaitKyrgyz RepublicLao PDRLate-demographic dividendLatin America & Caribbean Latin America & Caribbean (excluding high income)Latin America & the Caribbean (IDA & IBRD countries)LatviaLeast developed countries: UN classificationLebanonLesothoLibyaLithuaniaLow & middle incomeLow incomeLower middle incomeLuxembourgMacao SAR, ChinaMacedonia, FYRMadagascarMalawiMalaysiaMaldivesMaliMaltaMarshall IslandsMauritaniaMauritiusMexicoMicronesia, Fed. Sts.Middle East & North AfricaMiddle East & North Africa (excluding high income)Middle East & North Africa (IDA & IBRD countries)Middle incomeMoldovaMongoliaMontenegroMoroccoMozambiqueMyanmarNamibiaNepalNetherlandsNew CaledoniaNew ZealandNicaraguaNigerNigeriaNorth AmericaNorwayOECD membersOmanOther small statesPacific island small statesPakistanPalauPanamaPapua New GuineaParaguayPeruPhilippinesPolandPortugalPost-demographic dividendPre-demographic dividendPuerto RicoQatarRomaniaRussian FederationRwandaSao Tome and PrincipeSaudi ArabiaSenegalSerbiaSeychellesSierra LeoneSingaporeSlovak RepublicSloveniaSmall statesSolomon IslandsSomaliaSouth AfricaSouth AsiaSouth Asia (IDA & IBRD)SpainSri LankaSt. Kitts and NevisSt. LuciaSt. Vincent and the GrenadinesSub-Saharan Africa Sub-Saharan Africa (excluding high income)Sub-Saharan Africa (IDA & IBRD countries)SudanSurinameSwazilandSwedenSwitzerlandSyrian Arab RepublicTajikistanTanzaniaThailandTimor-LesteTogoTongaTrinidad and TobagoTunisiaTurkeyTurkmenistanTuvaluUgandaUkraineUnited KingdomUnited StatesUpper middle incomeUruguayUzbekistanVanuatuVenezuela, RBVietnamWest Bank and GazaWorldYemen, Rep.ZambiaZimbabwe Timeline:
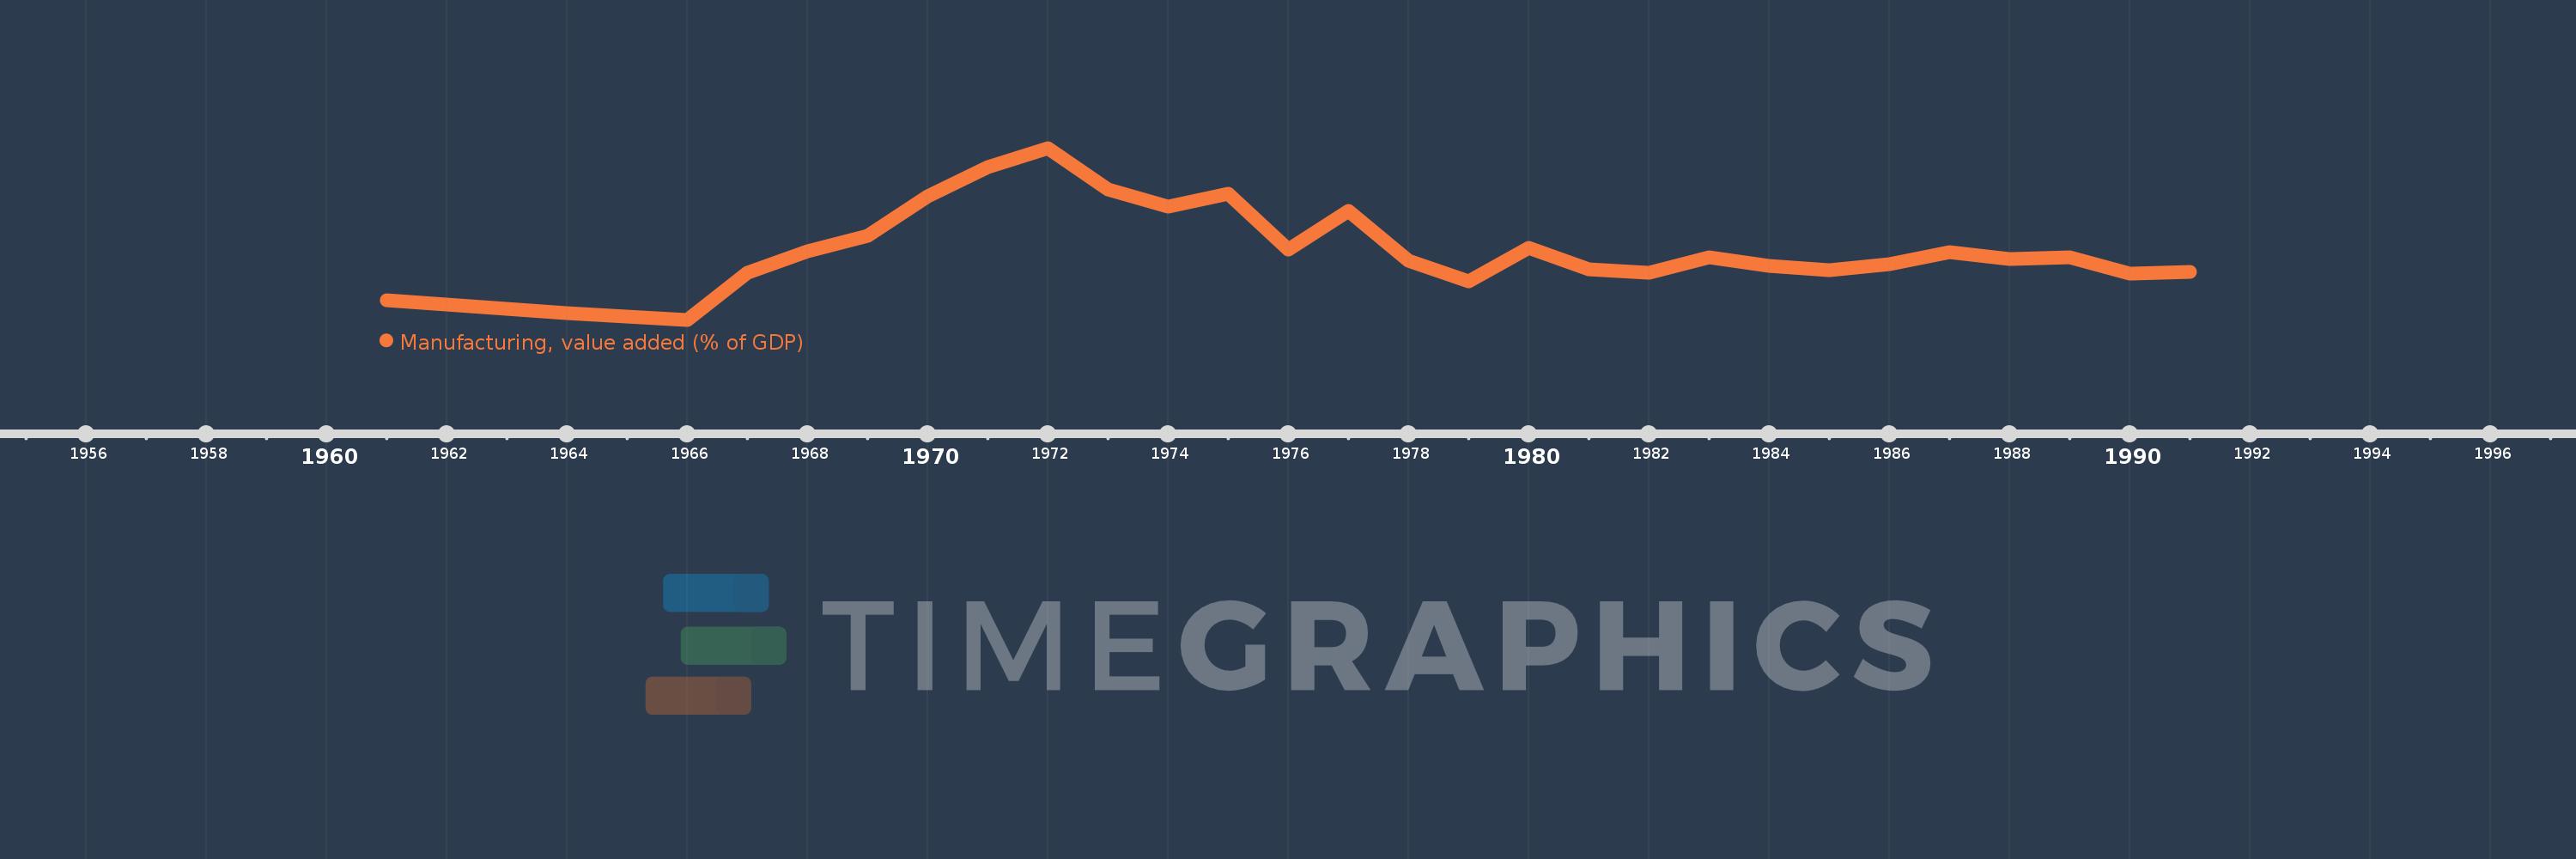
This timeline shows a graph from 1961 to 1991 of Somalia. No data until 1960. Number of actual observations by date: 31.
Source name:
World Development Indicators
Source organization:
World Bank national accounts data, and OECD National Accounts data files.
Categories, topics:
Economy & Growth
Last updated:
apr 23, 2017
Indicators value changes by year
Maximum:
10.122
jan 1, 1972
At the date of observation
Value
Absolute change
Change from previous value
jan 1, 1961
3.365
+3.365
0.0%
jan 1, 1962
3.168
-0.196
-5.84%
jan 1, 1963
2.983
-0.185
-5.84%
jan 1, 1964
2.809
-0.174
-5.84%
jan 1, 1965
2.645
-0.164
-5.84%
jan 1, 1966
2.51
-0.135
-5.11%
jan 1, 1967
4.608
+2.098
83.6%
jan 1, 1968
5.537
+0.929
20.16%
jan 1, 1969
6.217
+0.68
12.29%
jan 1, 1970
7.995
+1.778
28.59%
jan 1, 1971
9.288
+1.293
16.18%
jan 1, 1972
10.122
+0.834
8.98%
jan 1, 1973
8.292
-1.831
-18.09%
jan 1, 1974
7.511
-0.781
-9.42%
jan 1, 1975
8.09
+0.579
7.71%
jan 1, 1976
5.623
-2.467
-30.5%
jan 1, 1977
7.325
+1.702
30.27%
jan 1, 1978
5.12
-2.204
-30.09%
jan 1, 1979
4.212
-0.909
-17.75%
jan 1, 1980
5.693
+1.482
35.18%
jan 1, 1981
4.736
-0.957
-16.81%
jan 1, 1982
4.598
-0.138
-2.92%
jan 1, 1983
5.259
+0.661
14.38%
jan 1, 1984
4.896
-0.363
-6.91%
jan 1, 1985
4.692
-0.204
-4.17%
jan 1, 1986
4.978
+0.286
6.1%
jan 1, 1987
5.505
+0.526
10.57%
jan 1, 1988
5.216
-0.289
-5.24%
jan 1, 1989
5.295
+0.079
1.51%
jan 1, 1990
4.546
-0.748
-14.14%
jan 1, 1991
4.619
+0.072
1.59%
Ranking of countries by current statistics by years


Comments: