29
/
en
AIzaSyAYiBZKx7MnpbEhh9jyipgxe19OcubqV5w
April 1, 2024
148186
Guyana
GUY
true
2
1
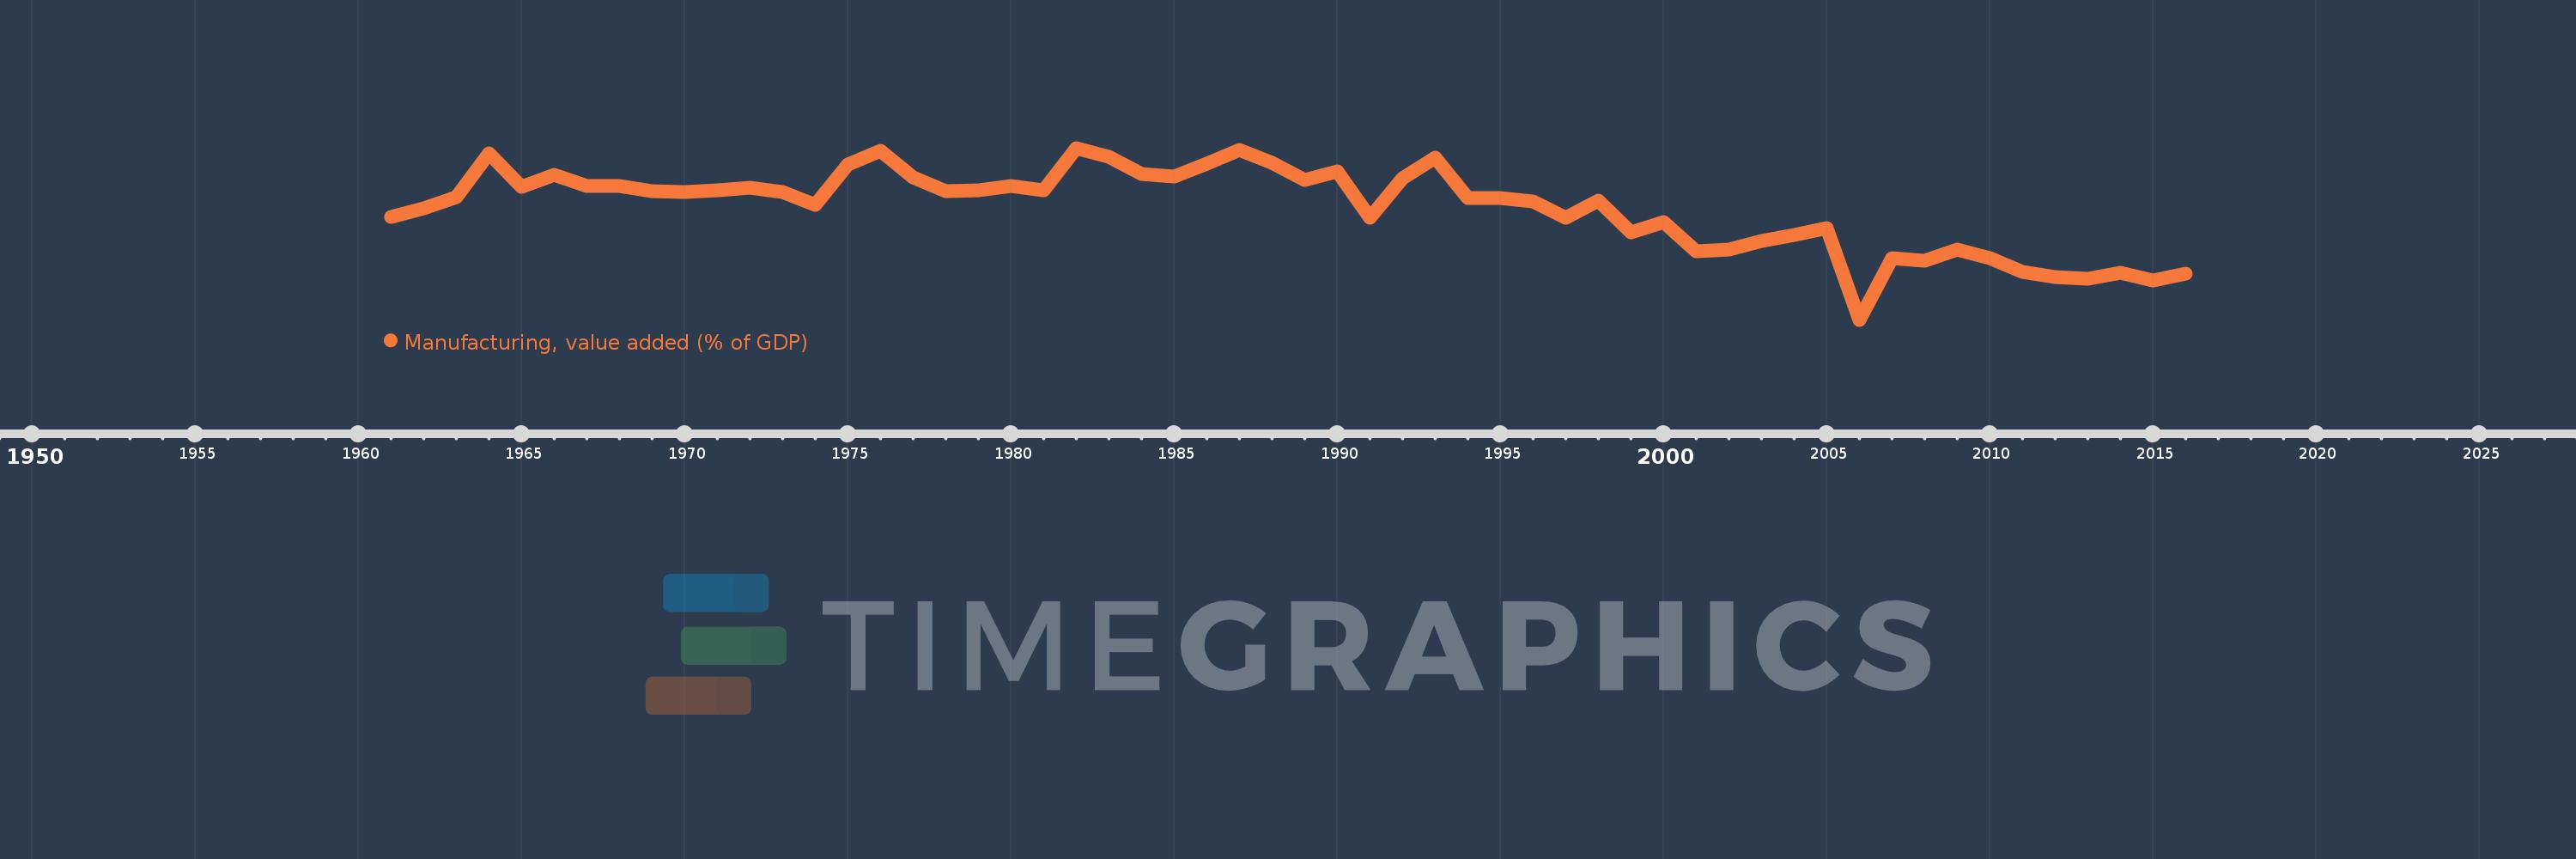
Manufacturing, value added (% of GDP)
2016,2015,2014,2013,2012,2011,2010,2009,2008,2007,2006,2005,2004,2003,2002,2001,2000,1999,1998,1997,1996,1995,1994,1993,1992,1991,1990,1989,1988,1987,1986,1985,1984,1983,1982,1981,1980,1979,1978,1977,1976,1975,1974,1973,1972,1971,1970,1969,1968,1967,1966,1965,1964,1963,1962,1961
This statistics in other country:
AfghanistanAlbaniaAlgeriaAndorraAngolaAntigua and BarbudaArab WorldArgentinaArmeniaArubaAustraliaAustriaAzerbaijanBahamas, TheBahrainBangladeshBarbadosBelarusBelgiumBelizeBeninBermudaBhutanBoliviaBosnia and HerzegovinaBotswanaBrazilBrunei DarussalamBurkina FasoBurundiCabo VerdeCambodiaCameroonCanadaCaribbean small statesCayman IslandsCentral African RepublicCentral Europe and the BalticsChadChileChinaColombiaComorosCongo, Dem. Rep.Congo, Rep.Costa RicaCote d'IvoireCroatiaCubaCyprusCzech RepublicDenmarkDjiboutiDominicaDominican RepublicEarly-demographic dividendEast Asia & PacificEast Asia & Pacific (excluding high income)East Asia & Pacific (IDA & IBRD countries)EcuadorEgypt, Arab Rep.El SalvadorEquatorial GuineaEritreaEstoniaEthiopiaEuro areaEurope & Central AsiaEurope & Central Asia (excluding high income)Europe & Central Asia (IDA & IBRD countries)European UnionFaroe IslandsFijiFinlandFragile and conflict affected situationsFranceGabonGambia, TheGeorgiaGermanyGhanaGreeceGrenadaGuatemalaGuineaGuinea-BissauGuyanaHeavily indebted poor countries (HIPC)High incomeHondurasHong Kong SAR, ChinaHungaryIBRD onlyIcelandIDA & IBRD totalIDA blendIDA onlyIDA totalIndiaIndonesiaIran, Islamic Rep.IrelandItalyJamaicaJapanJordanKazakhstanKenyaKiribatiKorea, Rep.KosovoKuwaitKyrgyz RepublicLao PDRLate-demographic dividendLatin America & Caribbean Latin America & Caribbean (excluding high income)Latin America & the Caribbean (IDA & IBRD countries)LatviaLeast developed countries: UN classificationLebanonLesothoLibyaLithuaniaLow & middle incomeLow incomeLower middle incomeLuxembourgMacao SAR, ChinaMacedonia, FYRMadagascarMalawiMalaysiaMaldivesMaliMaltaMarshall IslandsMauritaniaMauritiusMexicoMicronesia, Fed. Sts.Middle East & North AfricaMiddle East & North Africa (excluding high income)Middle East & North Africa (IDA & IBRD countries)Middle incomeMoldovaMongoliaMontenegroMoroccoMozambiqueMyanmarNamibiaNepalNetherlandsNew CaledoniaNew ZealandNicaraguaNigerNigeriaNorth AmericaNorwayOECD membersOmanOther small statesPacific island small statesPakistanPalauPanamaPapua New GuineaParaguayPeruPhilippinesPolandPortugalPost-demographic dividendPre-demographic dividendPuerto RicoQatarRomaniaRussian FederationRwandaSao Tome and PrincipeSaudi ArabiaSenegalSerbiaSeychellesSierra LeoneSingaporeSlovak RepublicSloveniaSmall statesSolomon IslandsSomaliaSouth AfricaSouth AsiaSouth Asia (IDA & IBRD)SpainSri LankaSt. Kitts and NevisSt. LuciaSt. Vincent and the GrenadinesSub-Saharan Africa Sub-Saharan Africa (excluding high income)Sub-Saharan Africa (IDA & IBRD countries)SudanSurinameSwazilandSwedenSwitzerlandSyrian Arab RepublicTajikistanTanzaniaThailandTimor-LesteTogoTongaTrinidad and TobagoTunisiaTurkeyTurkmenistanTuvaluUgandaUkraineUnited KingdomUnited StatesUpper middle incomeUruguayUzbekistanVanuatuVenezuela, RBVietnamWest Bank and GazaWorldYemen, Rep.ZambiaZimbabwe Timeline:
This timeline shows a graph from 1961 to 2016 of Guyana. No data until 1960. Number of actual observations by date: 56.
Source name:
World Development Indicators
Source organization:
World Bank national accounts data, and OECD National Accounts data files.
Categories, topics:
Economy & Growth
Last updated:
apr 23, 2017
Indicators value changes by year
Maximum:
14.889
jan 1, 1982
At the date of observation
Value
Absolute change
Change from previous value
jan 1, 1961
10.366
+10.366
0.0%
jan 1, 1962
10.941
+0.575
5.55%
jan 1, 1963
11.664
+0.723
6.61%
jan 1, 1964
14.537
+2.872
24.62%
jan 1, 1965
12.325
-2.212
-15.21%
jan 1, 1966
13.134
+0.809
6.57%
jan 1, 1967
12.423
-0.711
-5.41%
jan 1, 1968
12.403
-0.02
-0.16%
jan 1, 1969
12.093
-0.311
-2.5%
jan 1, 1970
11.989
-0.104
-0.86%
jan 1, 1971
12.128
+0.139
1.16%
jan 1, 1972
12.299
+0.172
1.42%
jan 1, 1973
12.041
-0.259
-2.1%
jan 1, 1974
11.155
-0.885
-7.35%
jan 1, 1975
13.831
+2.675
23.98%
jan 1, 1976
14.724
+0.894
6.46%
jan 1, 1977
12.992
-1.732
-11.76%
jan 1, 1978
12.056
-0.936
-7.21%
jan 1, 1979
12.107
+0.051
0.42%
jan 1, 1980
12.382
+0.275
2.27%
jan 1, 1981
12.126
-0.257
-2.07%
jan 1, 1982
14.889
+2.763
22.79%
jan 1, 1983
14.32
-0.569
-3.82%
jan 1, 1984
13.167
-1.153
-8.05%
jan 1, 1985
13.034
-0.132
-1.01%
jan 1, 1986
13.875
+0.841
6.45%
jan 1, 1987
14.752
+0.877
6.32%
jan 1, 1988
13.924
-0.828
-5.61%
jan 1, 1989
12.778
-1.146
-8.23%
jan 1, 1990
13.346
+0.568
4.45%
jan 1, 1991
10.315
-3.031
-22.71%
jan 1, 1992
12.911
+2.596
25.17%
jan 1, 1993
14.275
+1.364
10.57%
jan 1, 1994
11.621
-2.655
-18.6%
jan 1, 1995
11.603
-0.017
-0.15%
jan 1, 1996
11.404
-0.199
-1.71%
jan 1, 1997
10.322
-1.082
-9.49%
jan 1, 1998
11.438
+1.116
10.81%
jan 1, 1999
9.396
-2.042
-17.85%
jan 1, 2000
10.063
+0.667
7.1%
jan 1, 2001
8.154
-1.91
-18.98%
jan 1, 2002
8.254
+0.101
1.24%
jan 1, 2003
8.84
+0.585
7.09%
jan 1, 2004
9.239
+0.399
4.51%
jan 1, 2005
9.635
+0.396
4.29%
jan 1, 2006
3.679
-5.956
-61.81%
jan 1, 2007
7.672
+3.993
108.52%
jan 1, 2008
7.513
-0.159
-2.07%
jan 1, 2009
8.257
+0.744
9.9%
jan 1, 2010
7.706
-0.551
-6.68%
jan 1, 2011
6.805
-0.901
-11.69%
jan 1, 2012
6.461
-0.344
-5.05%
jan 1, 2013
6.34
-0.121
-1.87%
jan 1, 2014
6.729
+0.389
6.14%
jan 1, 2015
6.267
-0.463
-6.87%
jan 1, 2016
6.672
+0.405
6.46%
Ranking of countries by current statistics by years


Comments: