29
/
en
AIzaSyAYiBZKx7MnpbEhh9jyipgxe19OcubqV5w
April 1, 2024
61805
Upper middle income
UMC
false
2
1
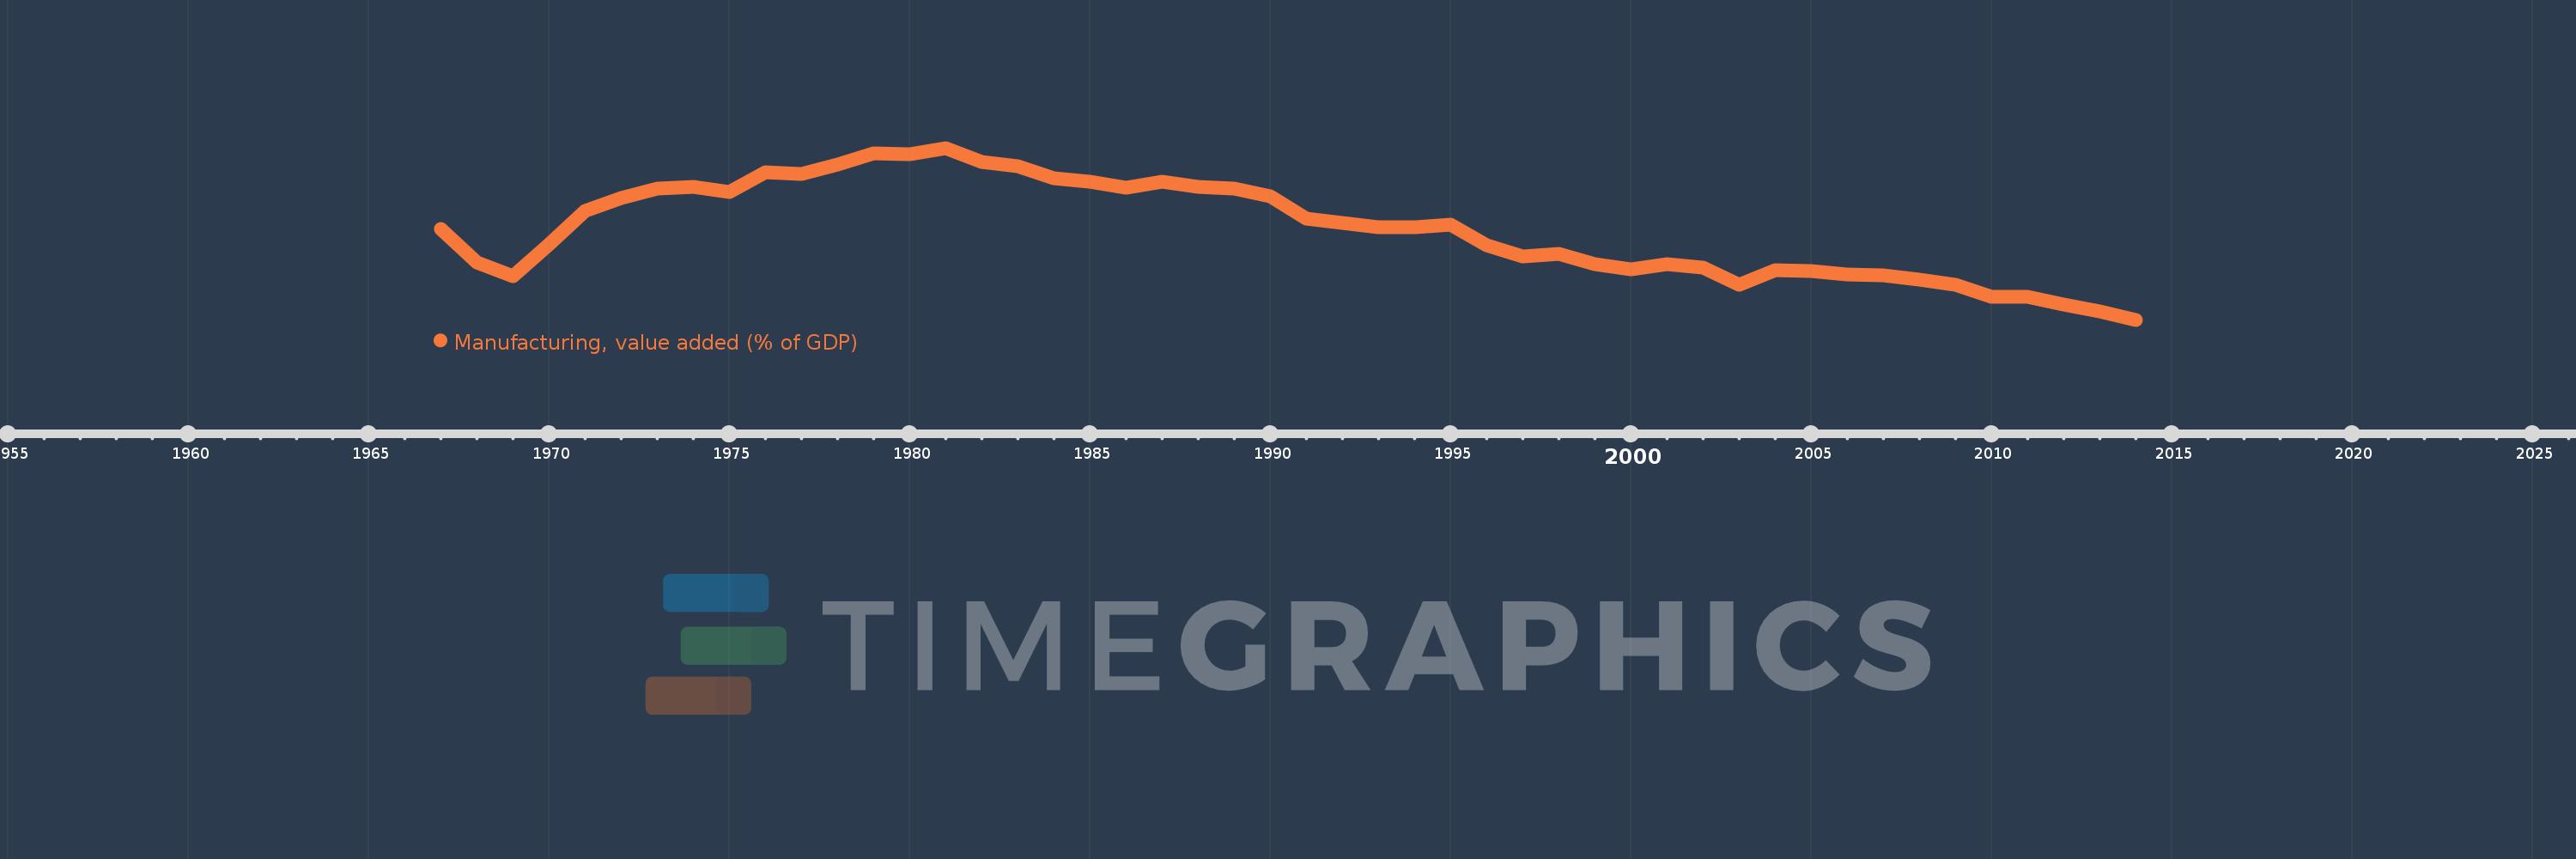
Manufacturing, value added (% of GDP)
2014,2013,2012,2011,2010,2009,2008,2007,2006,2005,2004,2003,2002,2001,2000,1999,1998,1997,1996,1995,1994,1993,1992,1991,1990,1989,1988,1987,1986,1985,1984,1983,1982,1981,1980,1979,1978,1977,1976,1975,1974,1973,1972,1971,1970,1969,1968,1967
This statistics in other country:
AfghanistanAlbaniaAlgeriaAndorraAngolaAntigua and BarbudaArab WorldArgentinaArmeniaArubaAustraliaAustriaAzerbaijanBahamas, TheBahrainBangladeshBarbadosBelarusBelgiumBelizeBeninBermudaBhutanBoliviaBosnia and HerzegovinaBotswanaBrazilBrunei DarussalamBurkina FasoBurundiCabo VerdeCambodiaCameroonCanadaCaribbean small statesCayman IslandsCentral African RepublicCentral Europe and the BalticsChadChileChinaColombiaComorosCongo, Dem. Rep.Congo, Rep.Costa RicaCote d'IvoireCroatiaCubaCyprusCzech RepublicDenmarkDjiboutiDominicaDominican RepublicEarly-demographic dividendEast Asia & PacificEast Asia & Pacific (excluding high income)East Asia & Pacific (IDA & IBRD countries)EcuadorEgypt, Arab Rep.El SalvadorEquatorial GuineaEritreaEstoniaEthiopiaEuro areaEurope & Central AsiaEurope & Central Asia (excluding high income)Europe & Central Asia (IDA & IBRD countries)European UnionFaroe IslandsFijiFinlandFragile and conflict affected situationsFranceGabonGambia, TheGeorgiaGermanyGhanaGreeceGrenadaGuatemalaGuineaGuinea-BissauGuyanaHeavily indebted poor countries (HIPC)High incomeHondurasHong Kong SAR, ChinaHungaryIBRD onlyIcelandIDA & IBRD totalIDA blendIDA onlyIDA totalIndiaIndonesiaIran, Islamic Rep.IrelandItalyJamaicaJapanJordanKazakhstanKenyaKiribatiKorea, Rep.KosovoKuwaitKyrgyz RepublicLao PDRLate-demographic dividendLatin America & Caribbean Latin America & Caribbean (excluding high income)Latin America & the Caribbean (IDA & IBRD countries)LatviaLeast developed countries: UN classificationLebanonLesothoLibyaLithuaniaLow & middle incomeLow incomeLower middle incomeLuxembourgMacao SAR, ChinaMacedonia, FYRMadagascarMalawiMalaysiaMaldivesMaliMaltaMarshall IslandsMauritaniaMauritiusMexicoMicronesia, Fed. Sts.Middle East & North AfricaMiddle East & North Africa (excluding high income)Middle East & North Africa (IDA & IBRD countries)Middle incomeMoldovaMongoliaMontenegroMoroccoMozambiqueMyanmarNamibiaNepalNetherlandsNew CaledoniaNew ZealandNicaraguaNigerNigeriaNorth AmericaNorwayOECD membersOmanOther small statesPacific island small statesPakistanPalauPanamaPapua New GuineaParaguayPeruPhilippinesPolandPortugalPost-demographic dividendPre-demographic dividendPuerto RicoQatarRomaniaRussian FederationRwandaSao Tome and PrincipeSaudi ArabiaSenegalSerbiaSeychellesSierra LeoneSingaporeSlovak RepublicSloveniaSmall statesSolomon IslandsSomaliaSouth AfricaSouth AsiaSouth Asia (IDA & IBRD)SpainSri LankaSt. Kitts and NevisSt. LuciaSt. Vincent and the GrenadinesSub-Saharan Africa Sub-Saharan Africa (excluding high income)Sub-Saharan Africa (IDA & IBRD countries)SudanSurinameSwazilandSwedenSwitzerlandSyrian Arab RepublicTajikistanTanzaniaThailandTimor-LesteTogoTongaTrinidad and TobagoTunisiaTurkeyTurkmenistanTuvaluUgandaUkraineUnited KingdomUnited StatesUpper middle incomeUruguayUzbekistanVanuatuVenezuela, RBVietnamWest Bank and GazaWorldYemen, Rep.ZambiaZimbabwe Timeline:
This timeline shows a graph from 1967 to 2014 of Upper middle income. No data until 1966. Number of actual observations by date: 48.
Source name:
World Development Indicators
Source organization:
World Bank national accounts data, and OECD National Accounts data files.
Categories, topics:
Economy & Growth
Last updated:
apr 23, 2017
Indicators value changes by year
Minimum:
21.044
jan 1, 2014
Maximum:
31.324
jan 1, 1981
At the date of observation
Value
Absolute change
Change from previous value
jan 1, 1967
26.477
+26.477
0.0%
jan 1, 1968
24.482
-1.995
-7.53%
jan 1, 1969
23.666
-0.817
-3.34%
jan 1, 1970
25.535
+1.869
7.9%
jan 1, 1971
27.575
+2.04
7.99%
jan 1, 1972
28.347
+0.772
2.8%
jan 1, 1973
28.88
+0.533
1.88%
jan 1, 1974
28.995
+0.115
0.4%
jan 1, 1975
28.698
-0.297
-1.03%
jan 1, 1976
29.866
+1.168
4.07%
jan 1, 1977
29.789
-0.077
-0.26%
jan 1, 1978
30.329
+0.539
1.81%
jan 1, 1979
31.022
+0.694
2.29%
jan 1, 1980
30.938
-0.084
-0.27%
jan 1, 1981
31.324
+0.385
1.25%
jan 1, 1982
30.463
-0.861
-2.75%
jan 1, 1983
30.216
-0.247
-0.81%
jan 1, 1984
29.519
-0.697
-2.31%
jan 1, 1985
29.288
-0.231
-0.78%
jan 1, 1986
28.927
-0.361
-1.23%
jan 1, 1987
29.282
+0.355
1.23%
jan 1, 1988
28.977
-0.305
-1.04%
jan 1, 1989
28.895
-0.081
-0.28%
jan 1, 1990
28.424
-0.471
-1.63%
jan 1, 1991
27.087
-1.337
-4.7%
jan 1, 1992
26.851
-0.237
-0.87%
jan 1, 1993
26.596
-0.255
-0.95%
jan 1, 1994
26.605
+0.009
0.03%
jan 1, 1995
26.718
+0.113
0.42%
jan 1, 1996
25.502
-1.215
-4.55%
jan 1, 1997
24.828
-0.674
-2.64%
jan 1, 1998
25.007
+0.179
0.72%
jan 1, 1999
24.377
-0.631
-2.52%
jan 1, 2000
24.069
-0.308
-1.26%
jan 1, 2001
24.35
+0.28
1.17%
jan 1, 2002
24.151
-0.198
-0.81%
jan 1, 2003
23.157
-0.994
-4.12%
jan 1, 2004
24.034
+0.877
3.79%
jan 1, 2005
23.962
-0.072
-0.3%
jan 1, 2006
23.768
-0.194
-0.81%
jan 1, 2007
23.717
-0.051
-0.21%
jan 1, 2008
23.419
-0.299
-1.26%
jan 1, 2009
23.147
-0.272
-1.16%
jan 1, 2010
22.396
-0.751
-3.25%
jan 1, 2011
22.419
+0.023
0.1%
jan 1, 2012
21.94
-0.479
-2.14%
jan 1, 2013
21.551
-0.389
-1.77%
jan 1, 2014
21.044
-0.507
-2.35%
Ranking of countries by current statistics by years


Comments: