29
/
en
AIzaSyAYiBZKx7MnpbEhh9jyipgxe19OcubqV5w
April 1, 2024
140651
Ghana
GHA
true
2
1
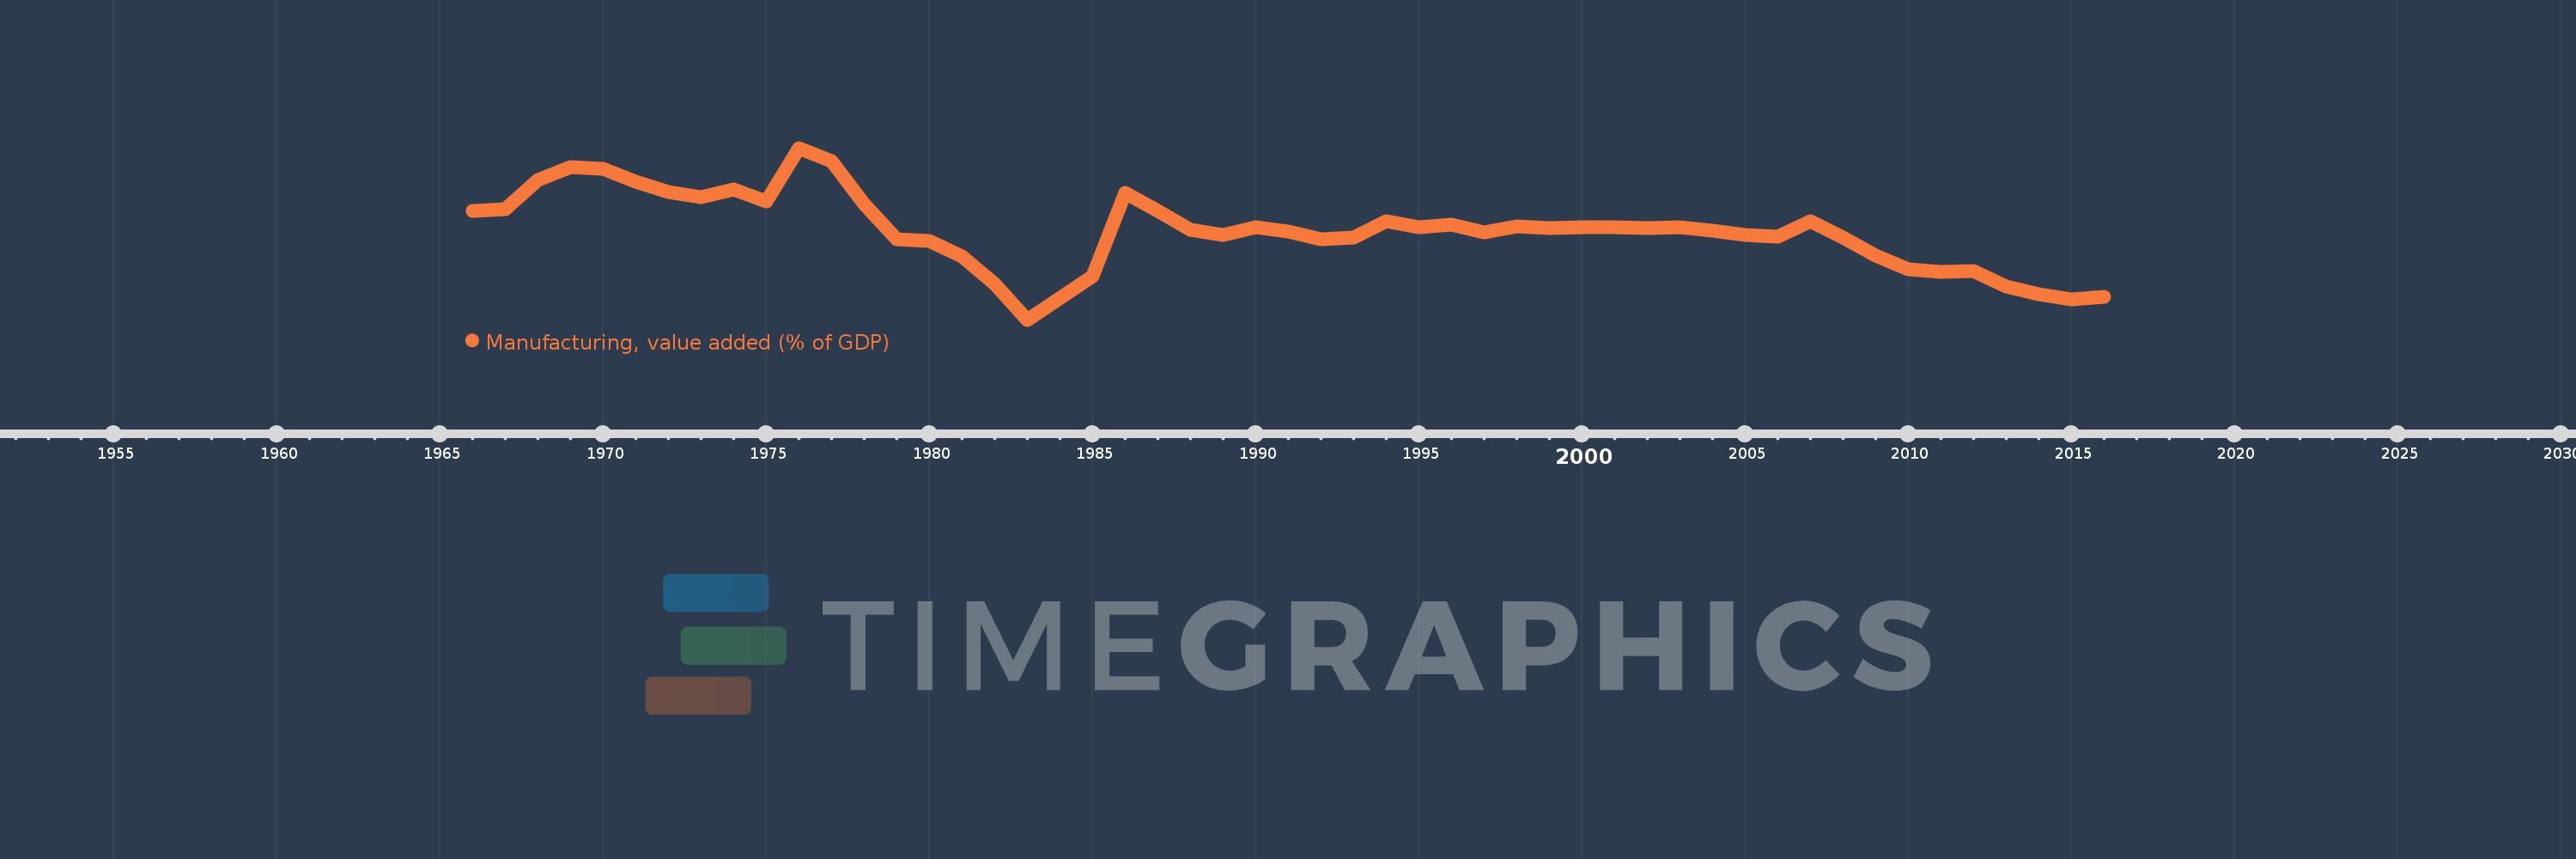
Manufacturing, value added (% of GDP)
2016,2015,2014,2013,2012,2011,2010,2009,2008,2007,2006,2005,2004,2003,2002,2001,2000,1999,1998,1997,1996,1995,1994,1993,1992,1991,1990,1989,1988,1987,1986,1985,1983,1982,1981,1980,1979,1978,1977,1976,1975,1974,1973,1972,1971,1970,1969,1968,1967,1966
This statistics in other country:
AfghanistanAlbaniaAlgeriaAndorraAngolaAntigua and BarbudaArab WorldArgentinaArmeniaArubaAustraliaAustriaAzerbaijanBahamas, TheBahrainBangladeshBarbadosBelarusBelgiumBelizeBeninBermudaBhutanBoliviaBosnia and HerzegovinaBotswanaBrazilBrunei DarussalamBurkina FasoBurundiCabo VerdeCambodiaCameroonCanadaCaribbean small statesCayman IslandsCentral African RepublicCentral Europe and the BalticsChadChileChinaColombiaComorosCongo, Dem. Rep.Congo, Rep.Costa RicaCote d'IvoireCroatiaCubaCyprusCzech RepublicDenmarkDjiboutiDominicaDominican RepublicEarly-demographic dividendEast Asia & PacificEast Asia & Pacific (excluding high income)East Asia & Pacific (IDA & IBRD countries)EcuadorEgypt, Arab Rep.El SalvadorEquatorial GuineaEritreaEstoniaEthiopiaEuro areaEurope & Central AsiaEurope & Central Asia (excluding high income)Europe & Central Asia (IDA & IBRD countries)European UnionFaroe IslandsFijiFinlandFragile and conflict affected situationsFranceGabonGambia, TheGeorgiaGermanyGhanaGreeceGrenadaGuatemalaGuineaGuinea-BissauGuyanaHeavily indebted poor countries (HIPC)High incomeHondurasHong Kong SAR, ChinaHungaryIBRD onlyIcelandIDA & IBRD totalIDA blendIDA onlyIDA totalIndiaIndonesiaIran, Islamic Rep.IrelandItalyJamaicaJapanJordanKazakhstanKenyaKiribatiKorea, Rep.KosovoKuwaitKyrgyz RepublicLao PDRLate-demographic dividendLatin America & Caribbean Latin America & Caribbean (excluding high income)Latin America & the Caribbean (IDA & IBRD countries)LatviaLeast developed countries: UN classificationLebanonLesothoLibyaLithuaniaLow & middle incomeLow incomeLower middle incomeLuxembourgMacao SAR, ChinaMacedonia, FYRMadagascarMalawiMalaysiaMaldivesMaliMaltaMarshall IslandsMauritaniaMauritiusMexicoMicronesia, Fed. Sts.Middle East & North AfricaMiddle East & North Africa (excluding high income)Middle East & North Africa (IDA & IBRD countries)Middle incomeMoldovaMongoliaMontenegroMoroccoMozambiqueMyanmarNamibiaNepalNetherlandsNew CaledoniaNew ZealandNicaraguaNigerNigeriaNorth AmericaNorwayOECD membersOmanOther small statesPacific island small statesPakistanPalauPanamaPapua New GuineaParaguayPeruPhilippinesPolandPortugalPost-demographic dividendPre-demographic dividendPuerto RicoQatarRomaniaRussian FederationRwandaSao Tome and PrincipeSaudi ArabiaSenegalSerbiaSeychellesSierra LeoneSingaporeSlovak RepublicSloveniaSmall statesSolomon IslandsSomaliaSouth AfricaSouth AsiaSouth Asia (IDA & IBRD)SpainSri LankaSt. Kitts and NevisSt. LuciaSt. Vincent and the GrenadinesSub-Saharan Africa Sub-Saharan Africa (excluding high income)Sub-Saharan Africa (IDA & IBRD countries)SudanSurinameSwazilandSwedenSwitzerlandSyrian Arab RepublicTajikistanTanzaniaThailandTimor-LesteTogoTongaTrinidad and TobagoTunisiaTurkeyTurkmenistanTuvaluUgandaUkraineUnited KingdomUnited StatesUpper middle incomeUruguayUzbekistanVanuatuVenezuela, RBVietnamWest Bank and GazaWorldYemen, Rep.ZambiaZimbabwe Timeline:
This timeline shows a graph from 1966 to 2016 of Ghana. No data until 1965. Number of actual observations by date: 50.
Source name:
World Development Indicators
Source organization:
World Bank national accounts data, and OECD National Accounts data files.
Categories, topics:
Economy & Growth
Last updated:
apr 23, 2017
Indicators value changes by year
Maximum:
15.542
jan 1, 1976
At the date of observation
Value
Absolute change
Change from previous value
jan 1, 1966
11.189
+11.189
0.0%
jan 1, 1967
11.306
+0.116
1.04%
jan 1, 1968
13.328
+2.023
17.89%
jan 1, 1969
14.21
+0.881
6.61%
jan 1, 1970
14.107
-0.103
-0.72%
jan 1, 1971
13.231
-0.876
-6.21%
jan 1, 1972
12.506
-0.725
-5.48%
jan 1, 1973
12.182
-0.324
-2.59%
jan 1, 1974
12.702
+0.52
4.27%
jan 1, 1975
11.834
-0.868
-6.83%
jan 1, 1976
15.542
+3.708
31.33%
jan 1, 1977
14.657
-0.885
-5.7%
jan 1, 1978
11.694
-2.963
-20.21%
jan 1, 1979
9.256
-2.438
-20.85%
jan 1, 1980
9.165
-0.09
-0.97%
jan 1, 1981
8.096
-1.069
-11.67%
jan 1, 1982
6.219
-1.878
-23.19%
jan 1, 1983
3.732
-2.486
-39.98%
jan 1, 1985
6.742
+3.01
80.64%
jan 1, 1986
12.442
+5.7
84.54%
jan 1, 1987
11.209
-1.233
-9.91%
jan 1, 1988
9.902
-1.306
-11.66%
jan 1, 1989
9.583
-0.319
-3.22%
jan 1, 1990
10.099
+0.515
5.38%
jan 1, 1991
9.811
-0.288
-2.85%
jan 1, 1992
9.282
-0.529
-5.39%
jan 1, 1993
9.37
+0.088
0.94%
jan 1, 1994
10.509
+1.14
12.17%
jan 1, 1995
10.116
-0.394
-3.75%
jan 1, 1996
10.271
+0.155
1.53%
jan 1, 1997
9.725
-0.546
-5.31%
jan 1, 1998
10.132
+0.407
4.18%
jan 1, 1999
10.04
-0.092
-0.9%
jan 1, 2000
10.072
+0.031
0.31%
jan 1, 2001
10.076
+0.004
0.04%
jan 1, 2002
10.046
-0.03
-0.29%
jan 1, 2003
10.071
+0.025
0.25%
jan 1, 2004
9.883
-0.188
-1.87%
jan 1, 2005
9.57
-0.312
-3.16%
jan 1, 2006
9.46
-0.11
-1.15%
jan 1, 2007
10.478
+1.018
10.76%
jan 1, 2008
9.366
-1.112
-10.61%
jan 1, 2009
8.138
-1.227
-13.1%
jan 1, 2010
7.19
-0.948
-11.65%
jan 1, 2011
7.024
-0.166
-2.31%
jan 1, 2012
7.064
+0.04
0.57%
jan 1, 2013
6.036
-1.028
-14.55%
jan 1, 2014
5.493
-0.543
-9.0%
jan 1, 2015
5.139
-0.354
-6.44%
jan 1, 2016
5.328
+0.189
3.67%
Ranking of countries by current statistics by years


Comments: