29
/
en
AIzaSyAYiBZKx7MnpbEhh9jyipgxe19OcubqV5w
April 1, 2024
80252
Belarus
BLR
true
2
1
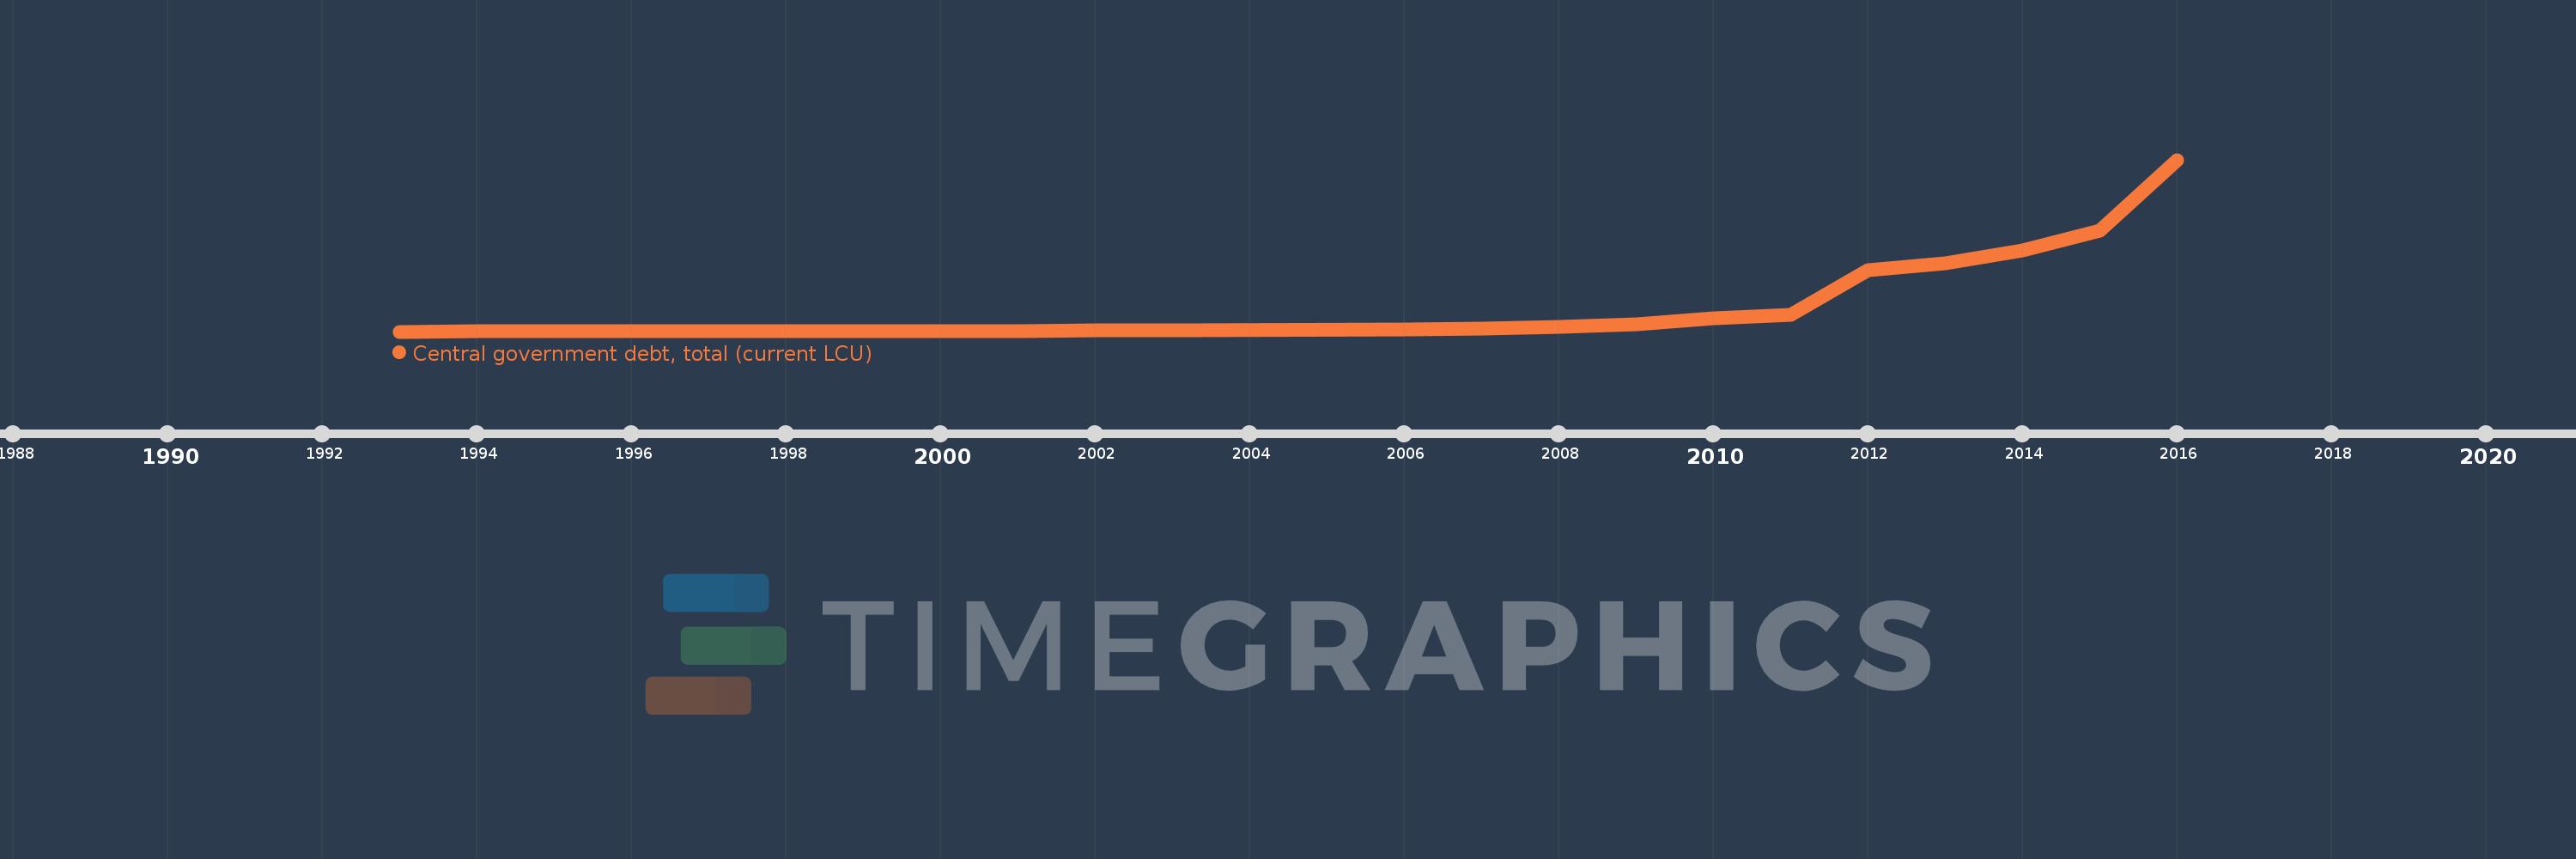
Central government debt, total (current LCU)
2016,2015,2014,2013,2012,2011,2010,2009,2008,2007,2006,2003,2002,2001,2000,1999,1998,1997,1996,1995,1994,1993
This statistics in other country:
Timeline:
This timeline shows a graph from 1993 to 2016 of Belarus. No data until 1992. Number of actual observations by date: 22.
Source name:
World Development Indicators
Source organization:
International Monetary Fund, Government Finance Statistics Yearbook and data files.
Categories, topics:
Public Sector
Last updated:
apr 23, 2017
Indicators value changes by year
Minimum:
23.7 mln
jan 1, 1993
Maximum:
338.045 trl
jan 1, 2016
At the date of observation
Value
Absolute change
Change from previous value
jan 1, 1993
23.7 mln
+23.7 mln
0.0%
jan 1, 1994
51.1 mln
+27.4 mln
115.61%
jan 1, 1995
13.515 bln
+13.464 bln
26.35K%
jan 1, 1996
20.493 bln
+6.978 bln
51.63%
jan 1, 1997
22.1 bln
+1.607 bln
7.84%
jan 1, 1998
44.649 bln
+22.549 bln
102.03%
jan 1, 1999
141.7 bln
+97.051 bln
217.37%
jan 1, 2000
457.03 bln
+315.33 bln
222.53%
jan 1, 2001
1.371 trl
+914.36 bln
200.07%
jan 1, 2002
1.965 trl
+593.33 bln
43.26%
jan 1, 2003
3.225 trl
+1.26 trl
64.13%
jan 1, 2006
4.275 trl
+1.05 trl
32.58%
jan 1, 2007
5.267 trl
+991.766 bln
23.2%
jan 1, 2008
8.657 trl
+3.39 trl
64.36%
jan 1, 2009
13.831 trl
+5.175 trl
59.78%
jan 1, 2010
26.369 trl
+12.537 trl
90.64%
jan 1, 2011
32.227 trl
+5.858 trl
22.22%
jan 1, 2012
121.106 trl
+88.879 trl
275.79%
jan 1, 2013
133.779 trl
+12.673 trl
10.46%
jan 1, 2014
159.874 trl
+26.095 trl
19.51%
jan 1, 2015
197.812 trl
+37.938 trl
23.73%
jan 1, 2016
338.045 trl
+140.233 trl
70.89%
Ranking of countries by current statistics by years


Comments: