29
/
en
AIzaSyAYiBZKx7MnpbEhh9jyipgxe19OcubqV5w
April 1, 2024
111937
Costa Rica
CRI
true
2
1
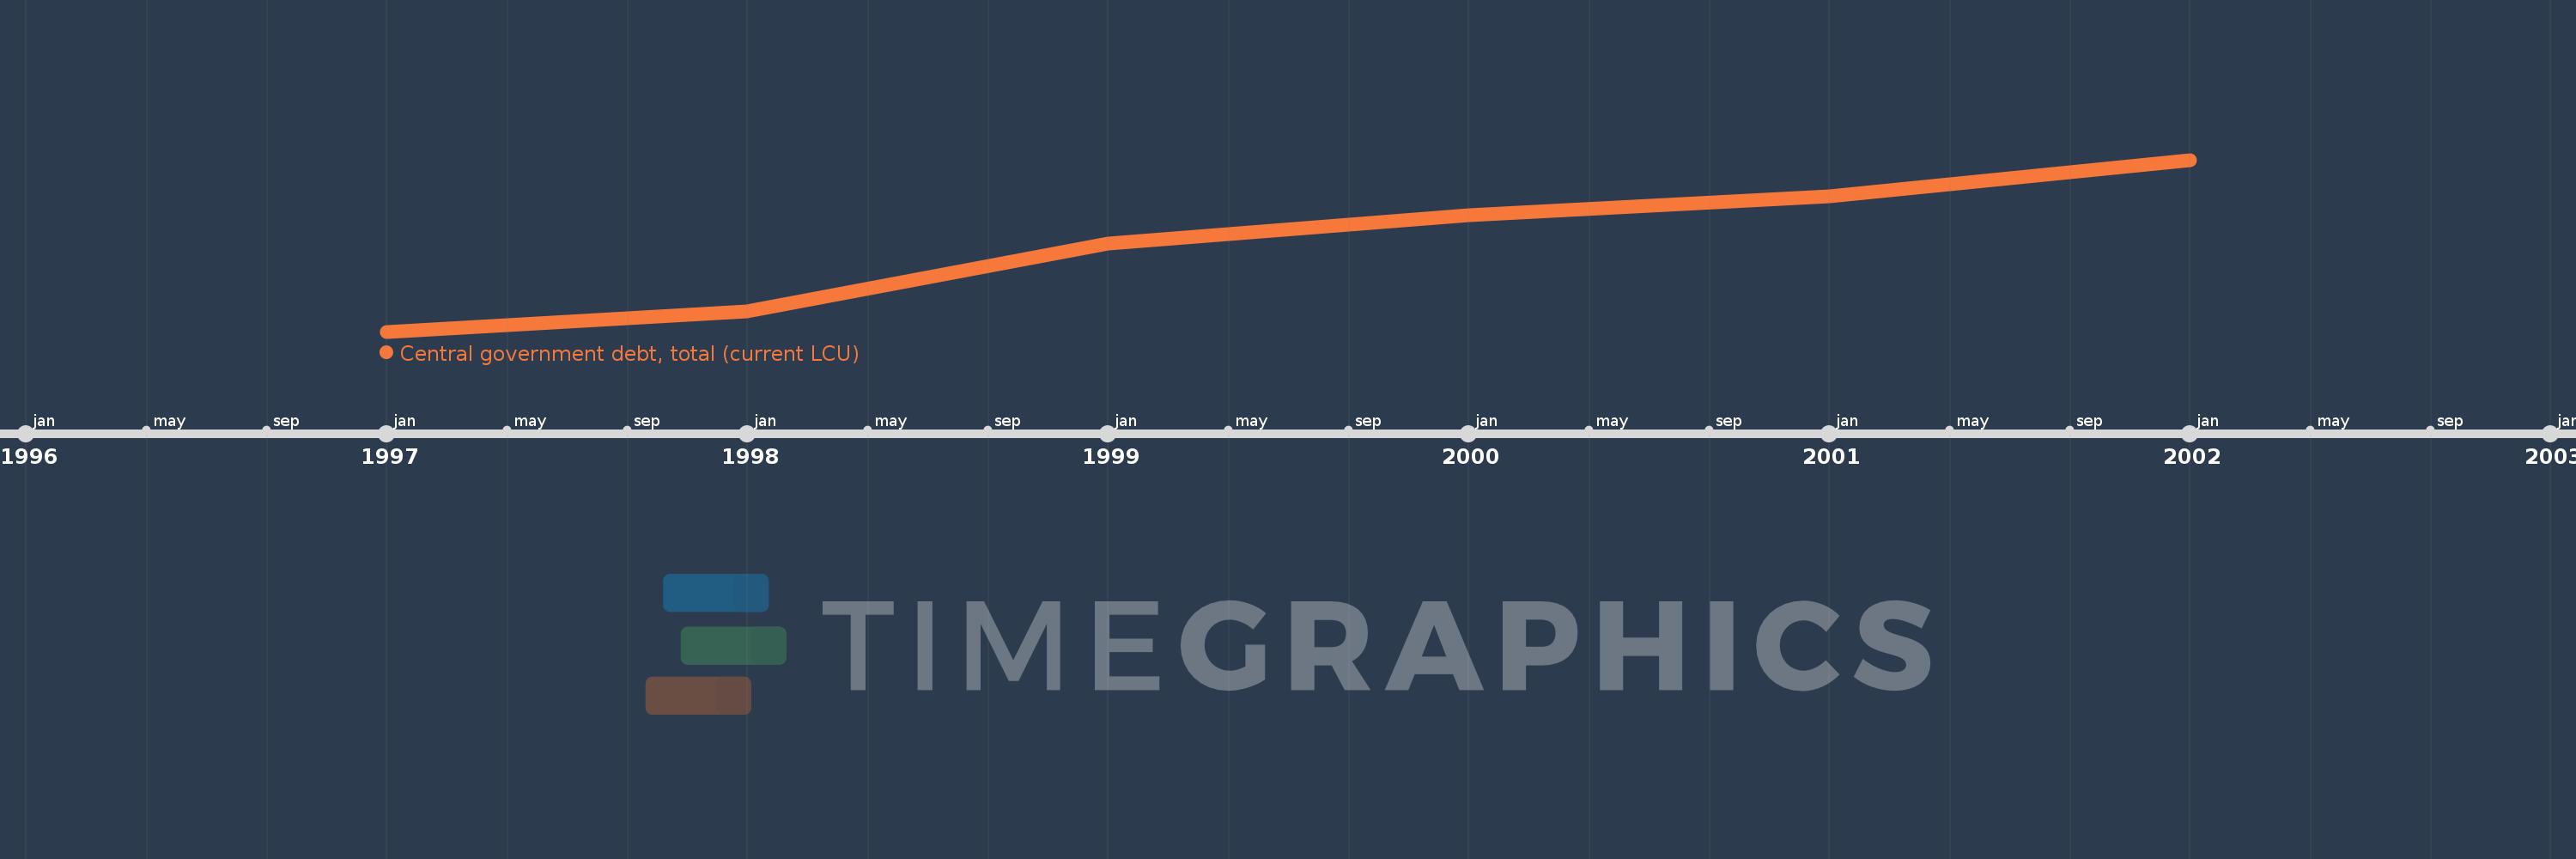
Central government debt, total (current LCU)
2002,2001,2000,1999,1998,1997
This statistics in other country:
Timeline:
This timeline shows a graph from 1997 to 2002 of Costa Rica. No data until 1996. Number of actual observations by date: 6.
Source name:
World Development Indicators
Source organization:
International Monetary Fund, Government Finance Statistics Yearbook and data files.
Categories, topics:
Public Sector
Last updated:
apr 23, 2017
Indicators value changes by year
Minimum:
730.1 bln
jan 1, 1997
Maximum:
2.067 trl
jan 1, 2002
At the date of observation
Value
Absolute change
Change from previous value
jan 1, 1997
730.1 bln
+730.1 bln
0.0%
jan 1, 1998
885.5 bln
+155.4 bln
21.28%
jan 1, 1999
1.415 trl
+529.5 bln
59.8%
jan 1, 2000
1.633 trl
+218.2 bln
15.42%
jan 1, 2001
1.782 trl
+148.3 bln
9.08%
jan 1, 2002
2.067 trl
+285.2 bln
16.01%
Ranking of countries by current statistics by years


Comments: