30
/
AIzaSyAYiBZKx7MnpbEhh9jyipgxe19OcubqV5w
April 1, 2024
247326
Spain
ESP
true
2
1
Central government debt, total (current LCU)
2014,2013,2012,2011,2010,2009,2008,2007,2006,2005,2004,2003,2002,2001,2000,1999,1998,1997,1996,1995,1994,1993,1992,1991
Public Timelines
FAQ
Menu
Public Timelines
FAQ
Public Timelines
FAQ
For education
For educational institutions
For teachers
For students
Open cabinet
For educational institutions
For teachers
For students
Open cabinet
Create
Close
Create a timeline
Public timelines
Library
FAQ
Download
Global statistics library
→
Spain
→
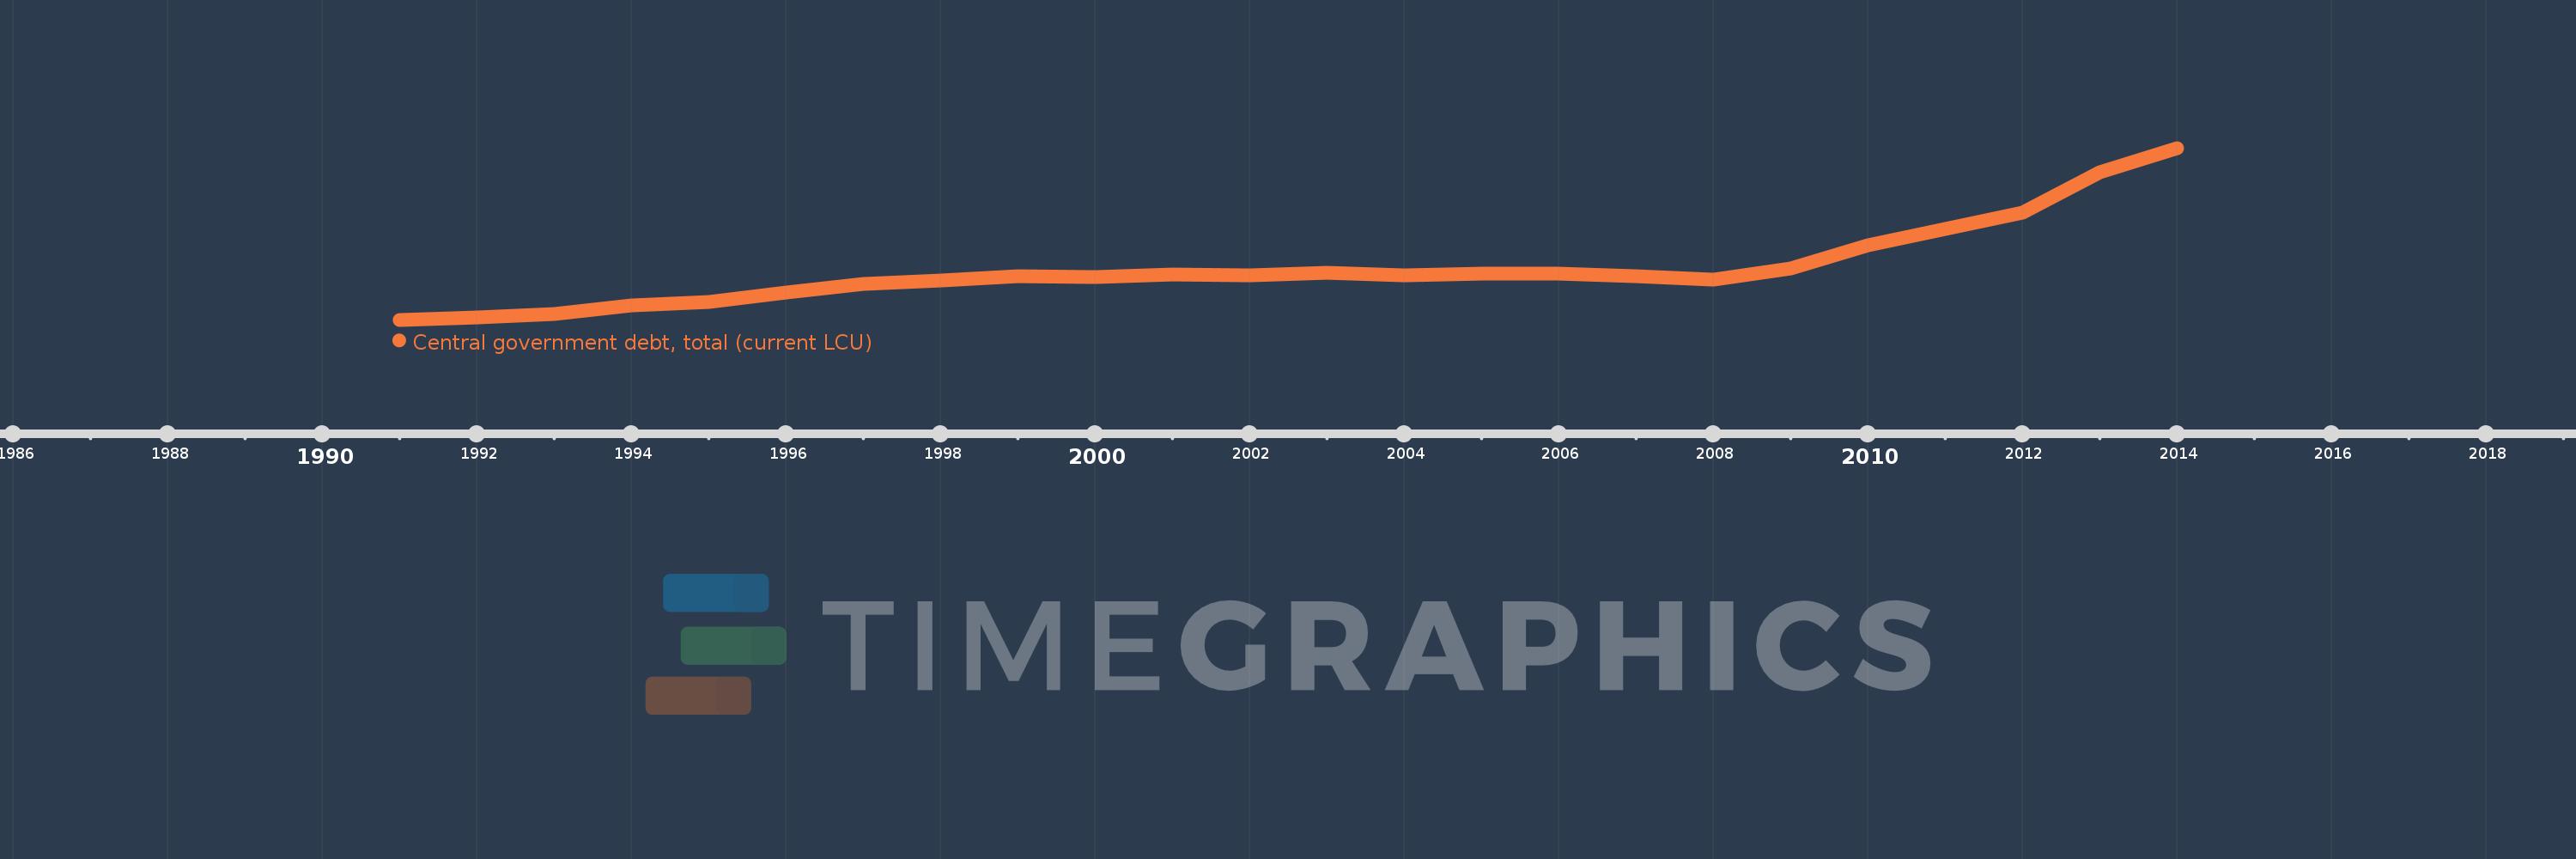
Central government debt, total (current LCU)
This statistics in other country:
Albania
Algeria
Antigua and Barbuda
Australia
Austria
Azerbaijan
Bahrain
Bangladesh
Barbados
Belarus
Belgium
Belize
Bhutan
Bolivia
Bosnia and Herzegovina
Botswana
Brazil
Bulgaria
Burundi
Canada
Colombia
Congo, Dem. Rep.
Congo, Rep.
Costa Rica
Cote d'Ivoire
Cyprus
Czech Republic
Denmark
Dominica
Dominican Republic
Egypt, Arab Rep.
El Salvador
Estonia
Ethiopia
Fiji
Finland
France
Georgia
Germany
Greece
Guatemala
Hong Kong SAR, China
Hungary
Iceland
India
Indonesia
Ireland
Israel
Italy
Jamaica
Japan
Jordan
Kazakhstan
Kenya
Korea, Rep.
Kyrgyz Republic
Latvia
Lebanon
Lesotho
Liberia
Lithuania
Luxembourg
Madagascar
Malawi
Malaysia
Maldives
Malta
Mauritius
Mexico
Micronesia, Fed. Sts.
Moldova
Mongolia
Morocco
Namibia
Nepal
Netherlands
New Zealand
Nigeria
Norway
Oman
Pakistan
Papua New Guinea
Peru
Philippines
Poland
Portugal
Romania
Russian Federation
Rwanda
Samoa
San Marino
Senegal
Seychelles
Sierra Leone
Singapore
Slovak Republic
Slovenia
Solomon Islands
South Africa
Spain
Sri Lanka
St. Kitts and Nevis
Swaziland
Sweden
Switzerland
Tajikistan
Thailand
Trinidad and Tobago
Tunisia
Turkey
Uganda
Ukraine
United Arab Emirates
United Kingdom
United States
Uruguay
Vanuatu
Zambia
Zimbabwe
Timeline:
This timeline shows a graph from
1991
to
2014
of Spain. No data until
1990
. Number of actual observations by date:
24
.
Source name:
World Development Indicators
Source organization:
International Monetary Fund, Government Finance Statistics Yearbook and data files.
Categories, topics:
Public Sector
Last updated:
apr 23, 2017
Indicators value changes by year
Meaning:
377.301 bln
Minimum:
115.478 bln
jan 1, 1991
Maximum:
994.892 bln
jan 1, 2014
At the date of observation
Value
Absolute change
Change from the previous value
jan 1, 1991
115.478 bln
+115.478 bln
0.0%
jan 1, 1992
126.749 bln
+11.271 bln
9.76%
jan 1, 1993
143.573 bln
+16.824 bln
13.27%
jan 1, 1994
187.557 bln
+43.983 bln
30.63%
jan 1, 1995
205.482 bln
+17.925 bln
9.56%
jan 1, 1996
254.466 bln
+48.984 bln
23.84%
jan 1, 1997
298.088 bln
+43.622 bln
17.14%
jan 1, 1998
314.336 bln
+16.248 bln
5.45%
jan 1, 1999
338.196 bln
+23.86 bln
7.59%
jan 1, 2000
332.496 bln
-5.7 bln
-1.69%
jan 1, 2001
345.348 bln
+12.852 bln
3.87%
jan 1, 2002
343.997 bln
-1.351 bln
-0.39%
jan 1, 2003
356.233 bln
+12.236 bln
3.56%
jan 1, 2004
344.279 bln
-11.954 bln
-3.36%
jan 1, 2005
352.722 bln
+8.443 bln
2.45%
jan 1, 2006
353.229 bln
+507.019 mln
0.14%
jan 1, 2007
339.936 bln
-13.293 bln
-3.76%
jan 1, 2008
321.229 bln
-18.707 bln
-5.5%
jan 1, 2009
378.037 bln
+56.808 bln
17.68%
jan 1, 2010
497.225 bln
+119.188 bln
31.53%
jan 1, 2011
579.526 bln
+82.301 bln
16.55%
jan 1, 2012
661.858 bln
+82.332 bln
14.21%
jan 1, 2013
870.287 bln
+208.429 bln
31.49%
jan 1, 2014
994.892 bln
+124.606 bln
14.32%
Ranking of countries by current statistics by years
About & Feedback
Terms
Privacy
Library
2024
©
Time.Graphics
Support 24/7
Cabinet
Get premium
Donate
The service accepts bank transfer (ACH, Wire) or cards (Visa, MasterCard, etc). Processed by Stripe.
Secured with SSL
Excellent (Trustpilot Reviews)
Based on 115+ reviews
Write your own review on
Trustpilot.com
