29
/
en
AIzaSyAYiBZKx7MnpbEhh9jyipgxe19OcubqV5w
April 1, 2024
256105
Sweden
SWE
true
2
1
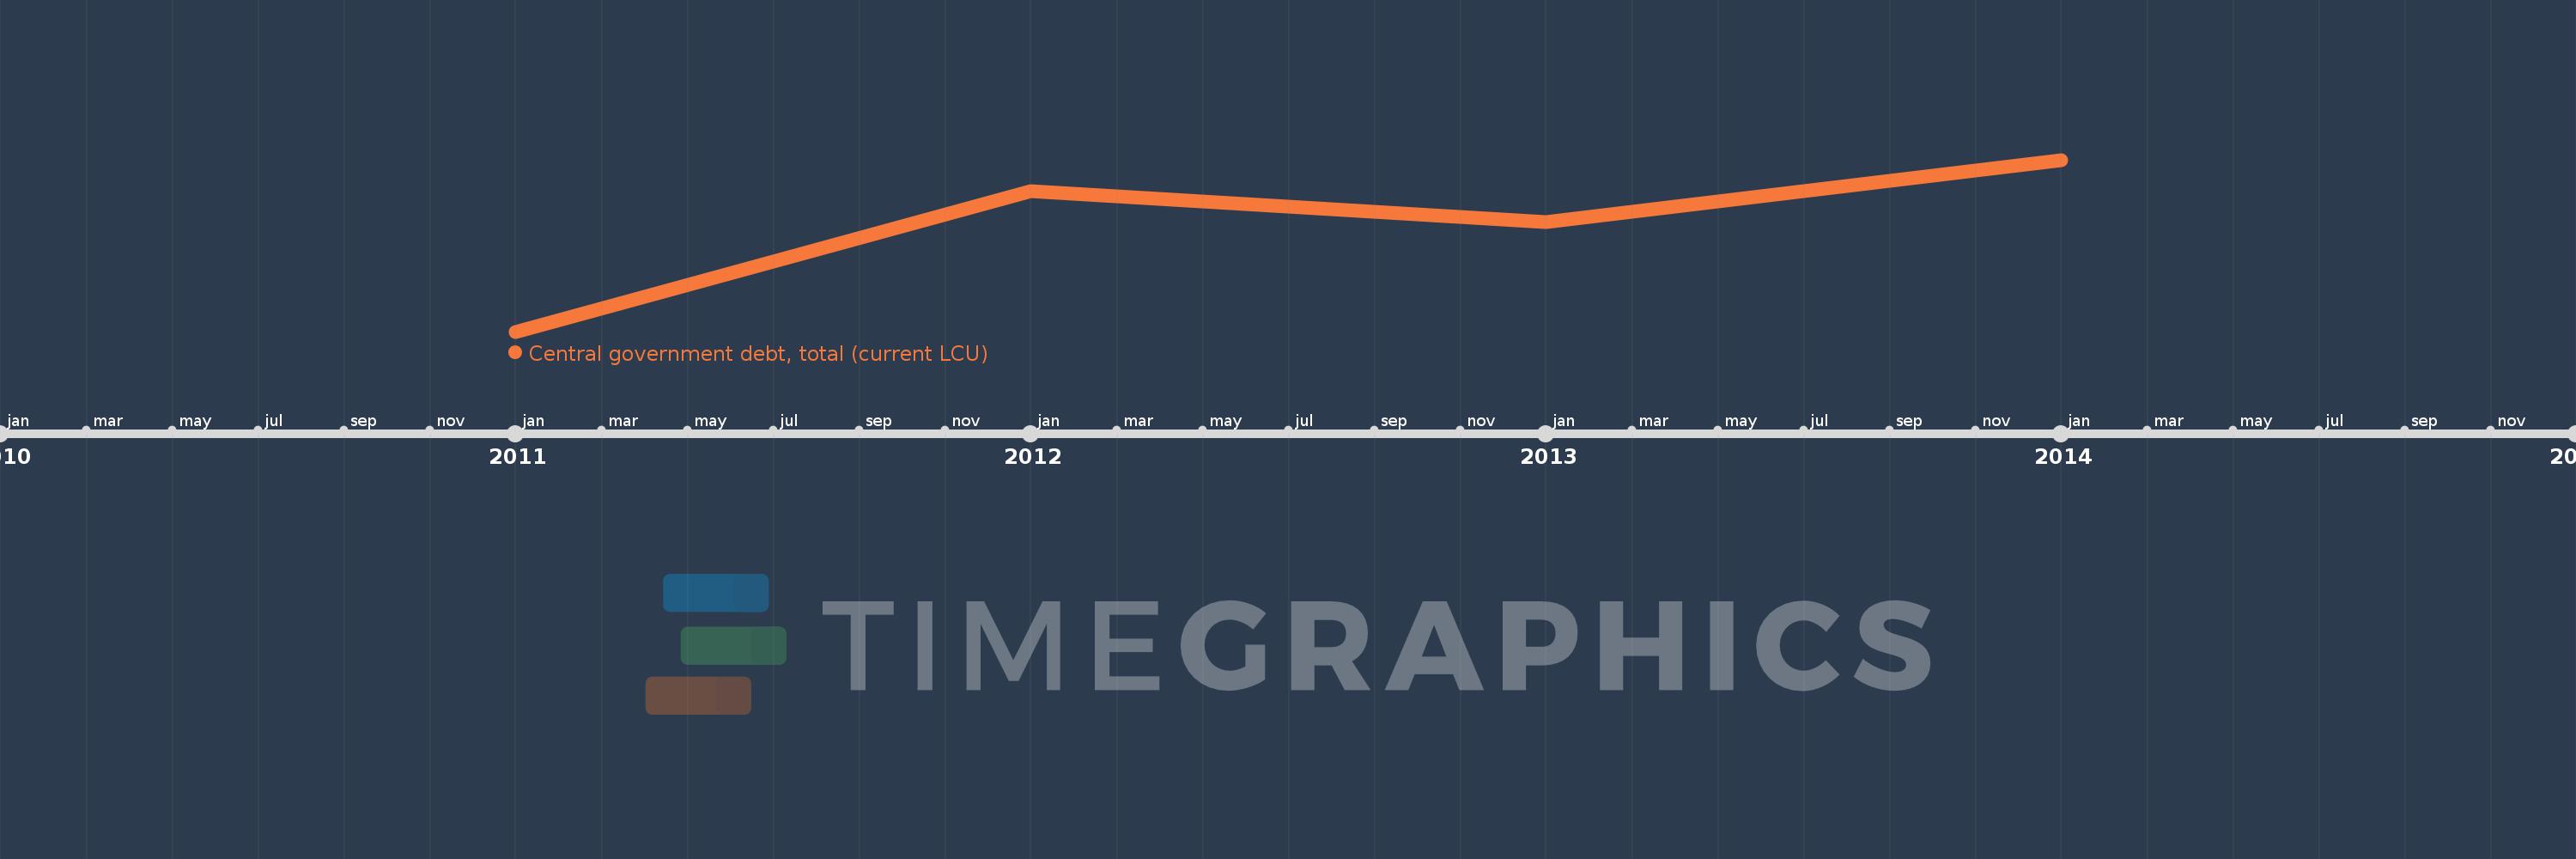
Central government debt, total (current LCU)
2014,2013,2012,2011
This statistics in other country:
Timeline:
This timeline shows a graph from 2011 to 2014 of Sweden. No data until 2010. Number of actual observations by date: 4.
Source name:
World Development Indicators
Source organization:
International Monetary Fund, Government Finance Statistics Yearbook and data files.
Categories, topics:
Public Sector
Last updated:
apr 23, 2017
Indicators value changes by year
Minimum:
1.488 trl
jan 1, 2011
Maximum:
1.583 trl
jan 1, 2014
At the date of observation
Value
Absolute change
Change from previous value
jan 1, 2011
1.488 trl
+1.488 trl
0.0%
jan 1, 2012
1.566 trl
+77.24 bln
5.19%
jan 1, 2013
1.548 trl
-17.215 bln
-1.1%
jan 1, 2014
1.583 trl
+34.228 bln
2.21%
Ranking of countries by current statistics by years


Comments: