29
/
en
AIzaSyAYiBZKx7MnpbEhh9jyipgxe19OcubqV5w
April 1, 2024
187521
Malaysia
MYS
true
2
1
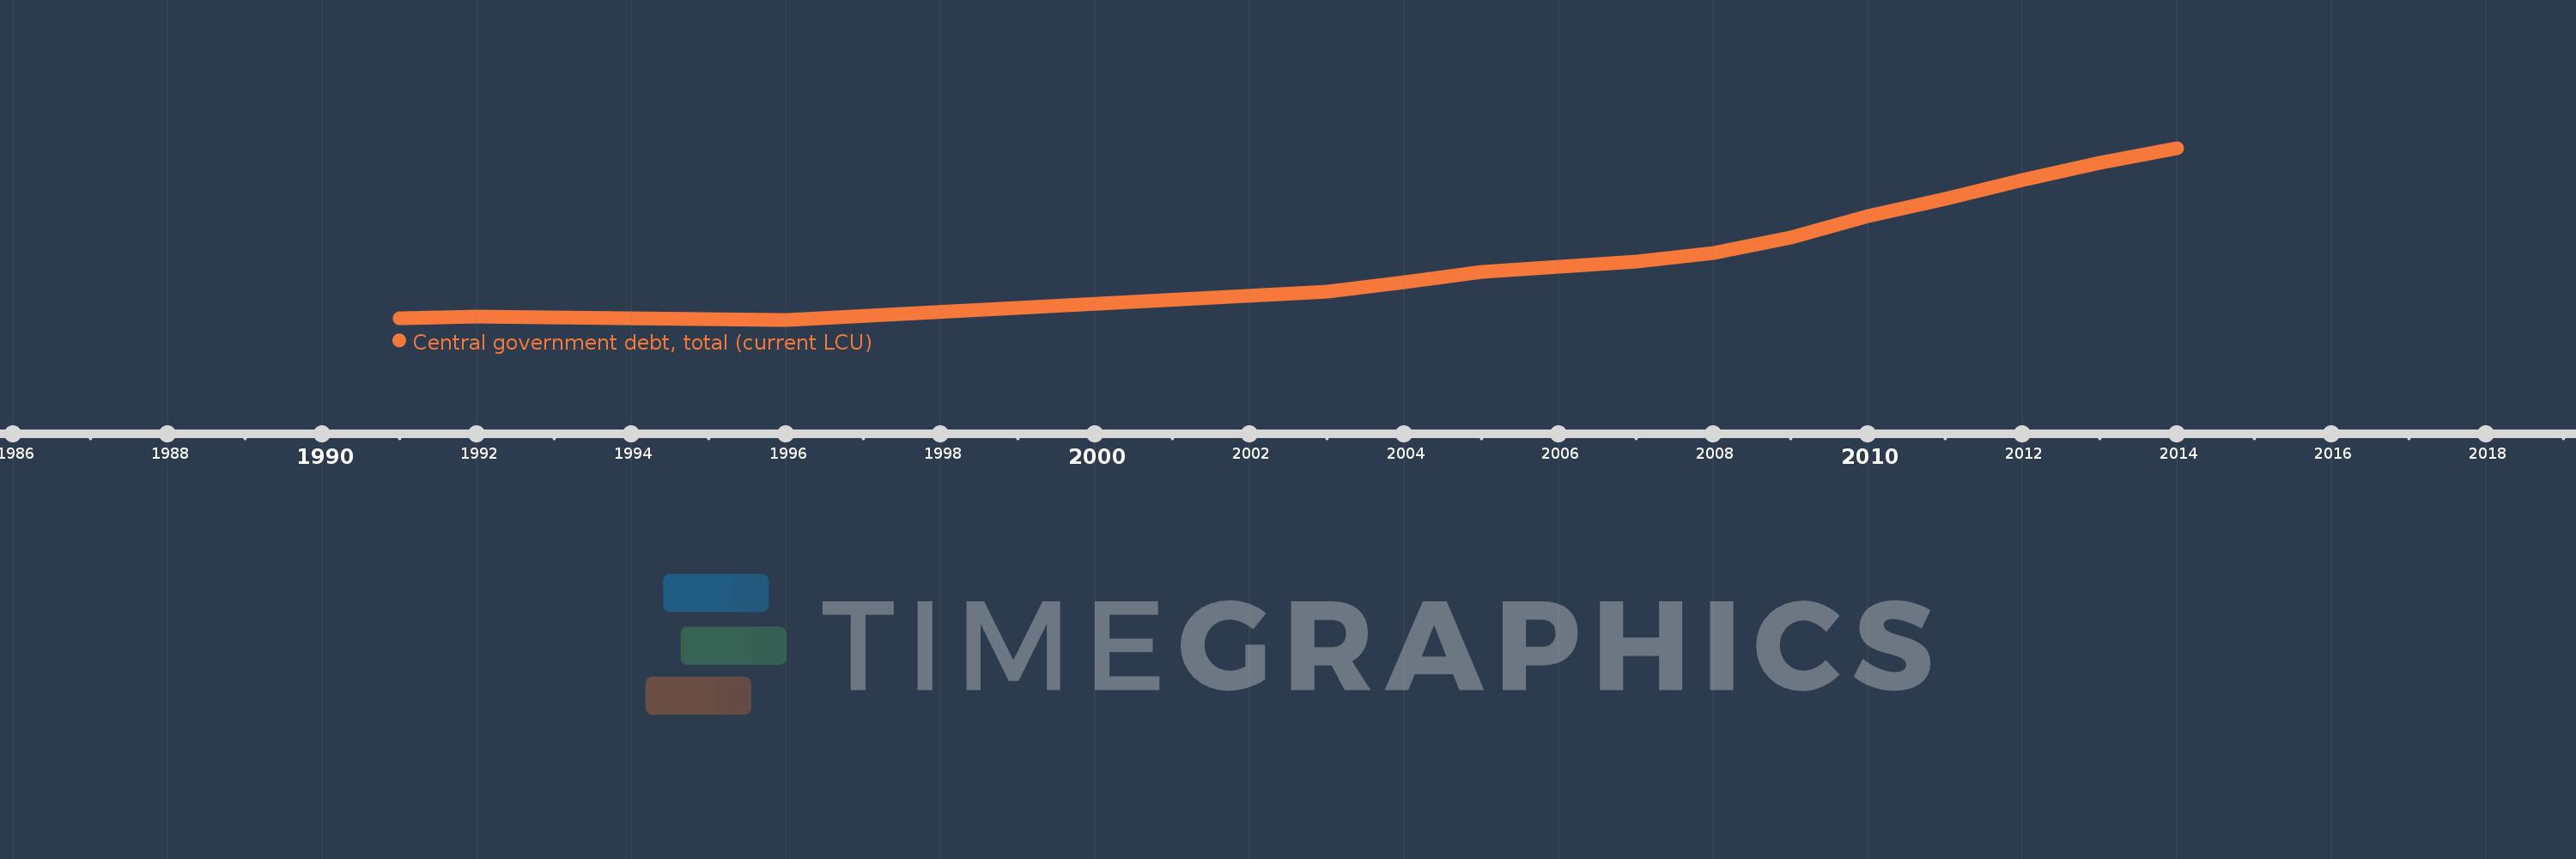
Central government debt, total (current LCU)
2014,2013,2012,2011,2010,2009,2008,2007,2006,2005,2004,2003,1996,1995,1994,1993,1992,1991
This statistics in other country:
Timeline:
This timeline shows a graph from 1991 to 2014 of Malaysia. No data until 1990. Number of actual observations by date: 18.
Source name:
World Development Indicators
Source organization:
International Monetary Fund, Government Finance Statistics Yearbook and data files.
Categories, topics:
Public Sector
Last updated:
apr 23, 2017
Indicators value changes by year
Minimum:
91.369 bln
jan 1, 1996
Maximum:
539.858 bln
jan 1, 2014
At the date of observation
Value
Absolute change
Change from previous value
jan 1, 1991
94.713 bln
+94.713 bln
0.0%
jan 1, 1992
99.072 bln
+4.359 bln
4.6%
jan 1, 1993
97.005 bln
-2.067 bln
-2.09%
jan 1, 1994
95.898 bln
-1.107 bln
-1.14%
jan 1, 1995
93.078 bln
-2.82 bln
-2.94%
jan 1, 1996
91.369 bln
-1.709 bln
-1.84%
jan 1, 2003
164.963 bln
+73.594 bln
80.55%
jan 1, 2004
188.767 bln
+23.804 bln
14.43%
jan 1, 2005
216.624 bln
+27.857 bln
14.76%
jan 1, 2006
228.67 bln
+12.046 bln
5.56%
jan 1, 2007
242.225 bln
+13.555 bln
5.93%
jan 1, 2008
266.722 bln
+24.497 bln
10.11%
jan 1, 2009
306.437 bln
+39.715 bln
14.89%
jan 1, 2010
362.386 bln
+55.949 bln
18.26%
jan 1, 2011
407.101 bln
+44.715 bln
12.34%
jan 1, 2012
456.128 bln
+49.027 bln
12.04%
jan 1, 2013
501.617 bln
+45.489 bln
9.97%
jan 1, 2014
539.858 bln
+38.241 bln
7.62%
Ranking of countries by current statistics by years


Comments: