29
/
en
AIzaSyAYiBZKx7MnpbEhh9jyipgxe19OcubqV5w
April 1, 2024
243392
Solomon Islands
SLB
true
2
1
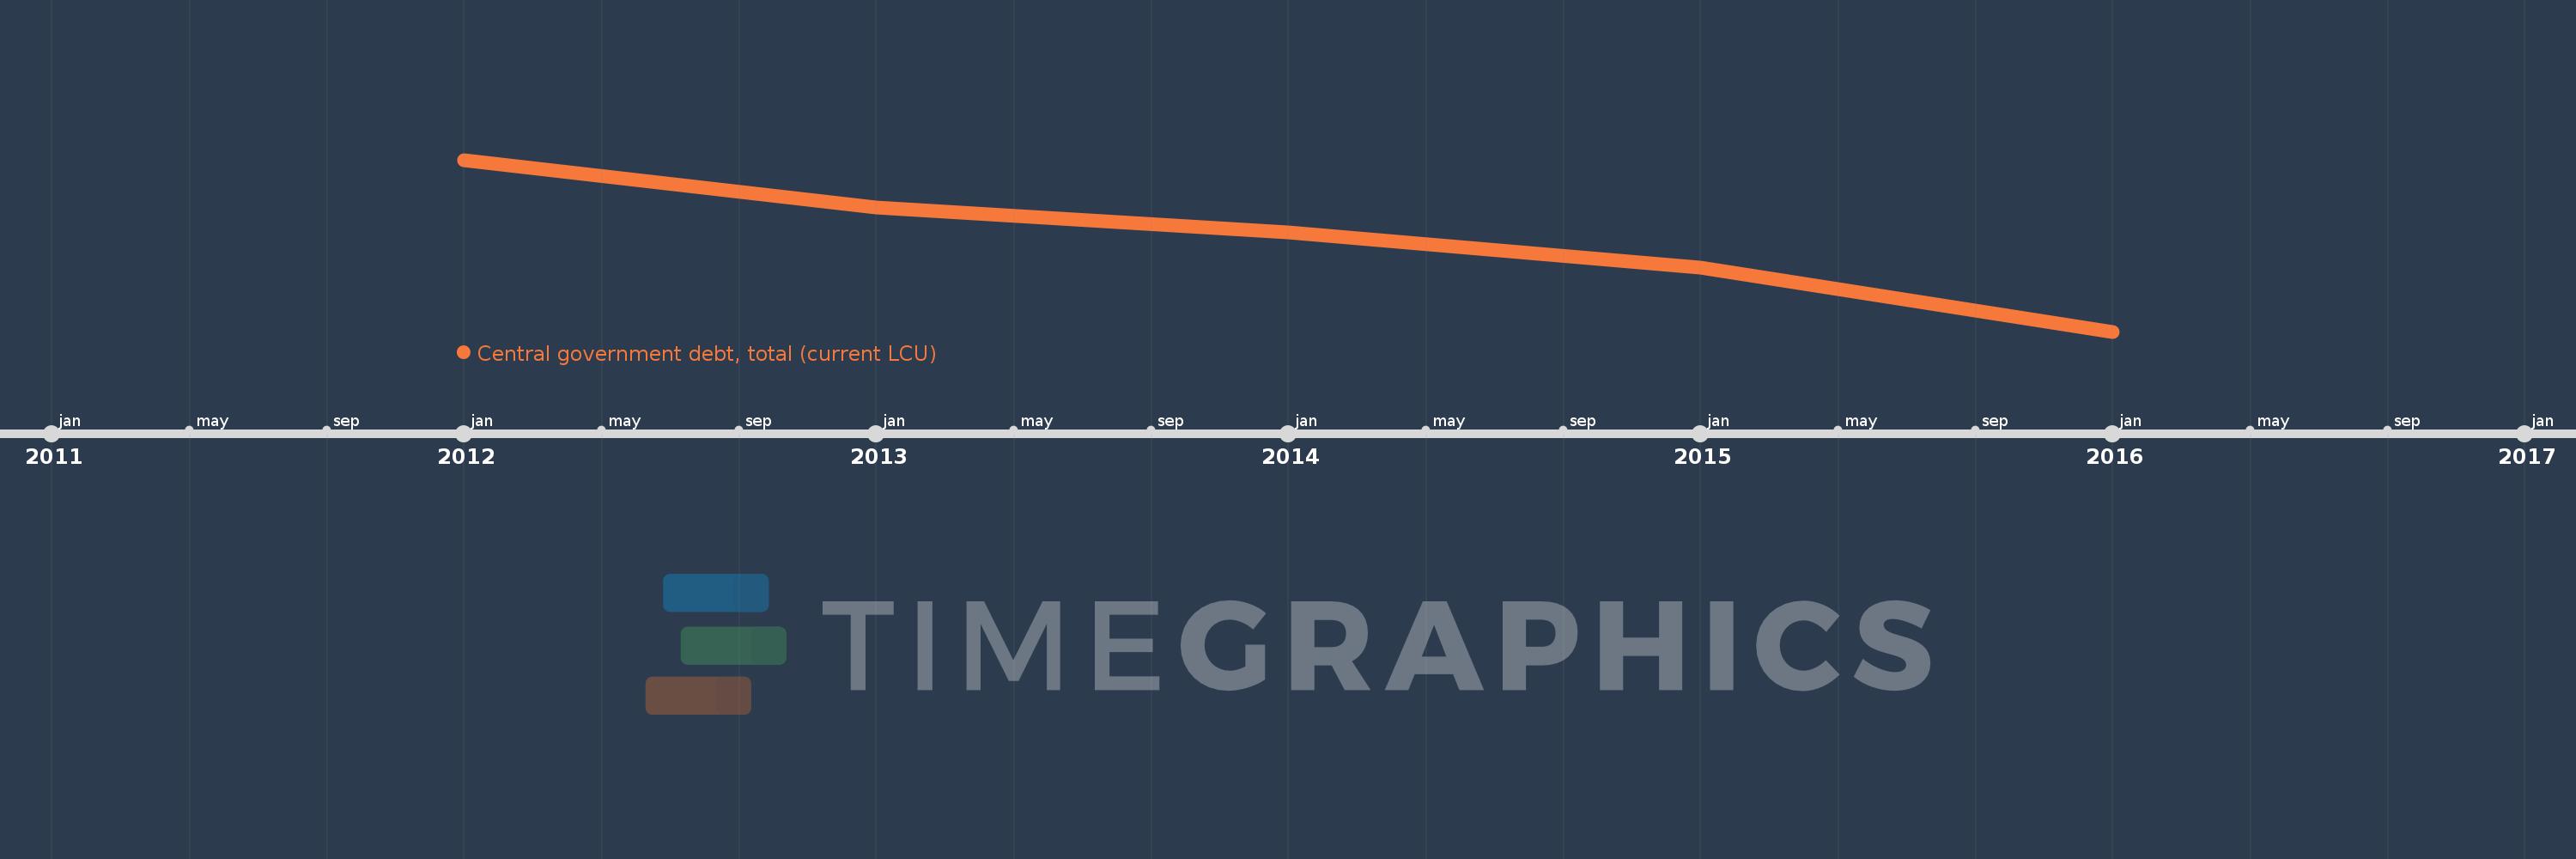
Central government debt, total (current LCU)
2016,2015,2014,2013,2012
This statistics in other country:
Timeline:
This timeline shows a graph from 2012 to 2016 of Solomon Islands. No data until 2011. Number of actual observations by date: 5.
Source name:
World Development Indicators
Source organization:
International Monetary Fund, Government Finance Statistics Yearbook and data files.
Categories, topics:
Public Sector
Last updated:
apr 23, 2017
Indicators value changes by year
Minimum:
697.459 mln
jan 1, 2016
Maximum:
1.132 bln
jan 1, 2012
At the date of observation
Value
Absolute change
Change from previous value
jan 1, 2012
1.132 bln
+1.132 bln
0.0%
jan 1, 2013
1.011 bln
-121.609 mln
-10.74%
jan 1, 2014
948.876 mln
-61.695 mln
-6.1%
jan 1, 2015
858.98 mln
-89.896 mln
-9.47%
jan 1, 2016
697.459 mln
-161.521 mln
-18.8%
Ranking of countries by current statistics by years


Comments: