29
/
en
AIzaSyAYiBZKx7MnpbEhh9jyipgxe19OcubqV5w
April 1, 2024
159192
Ireland
IRL
true
2
1
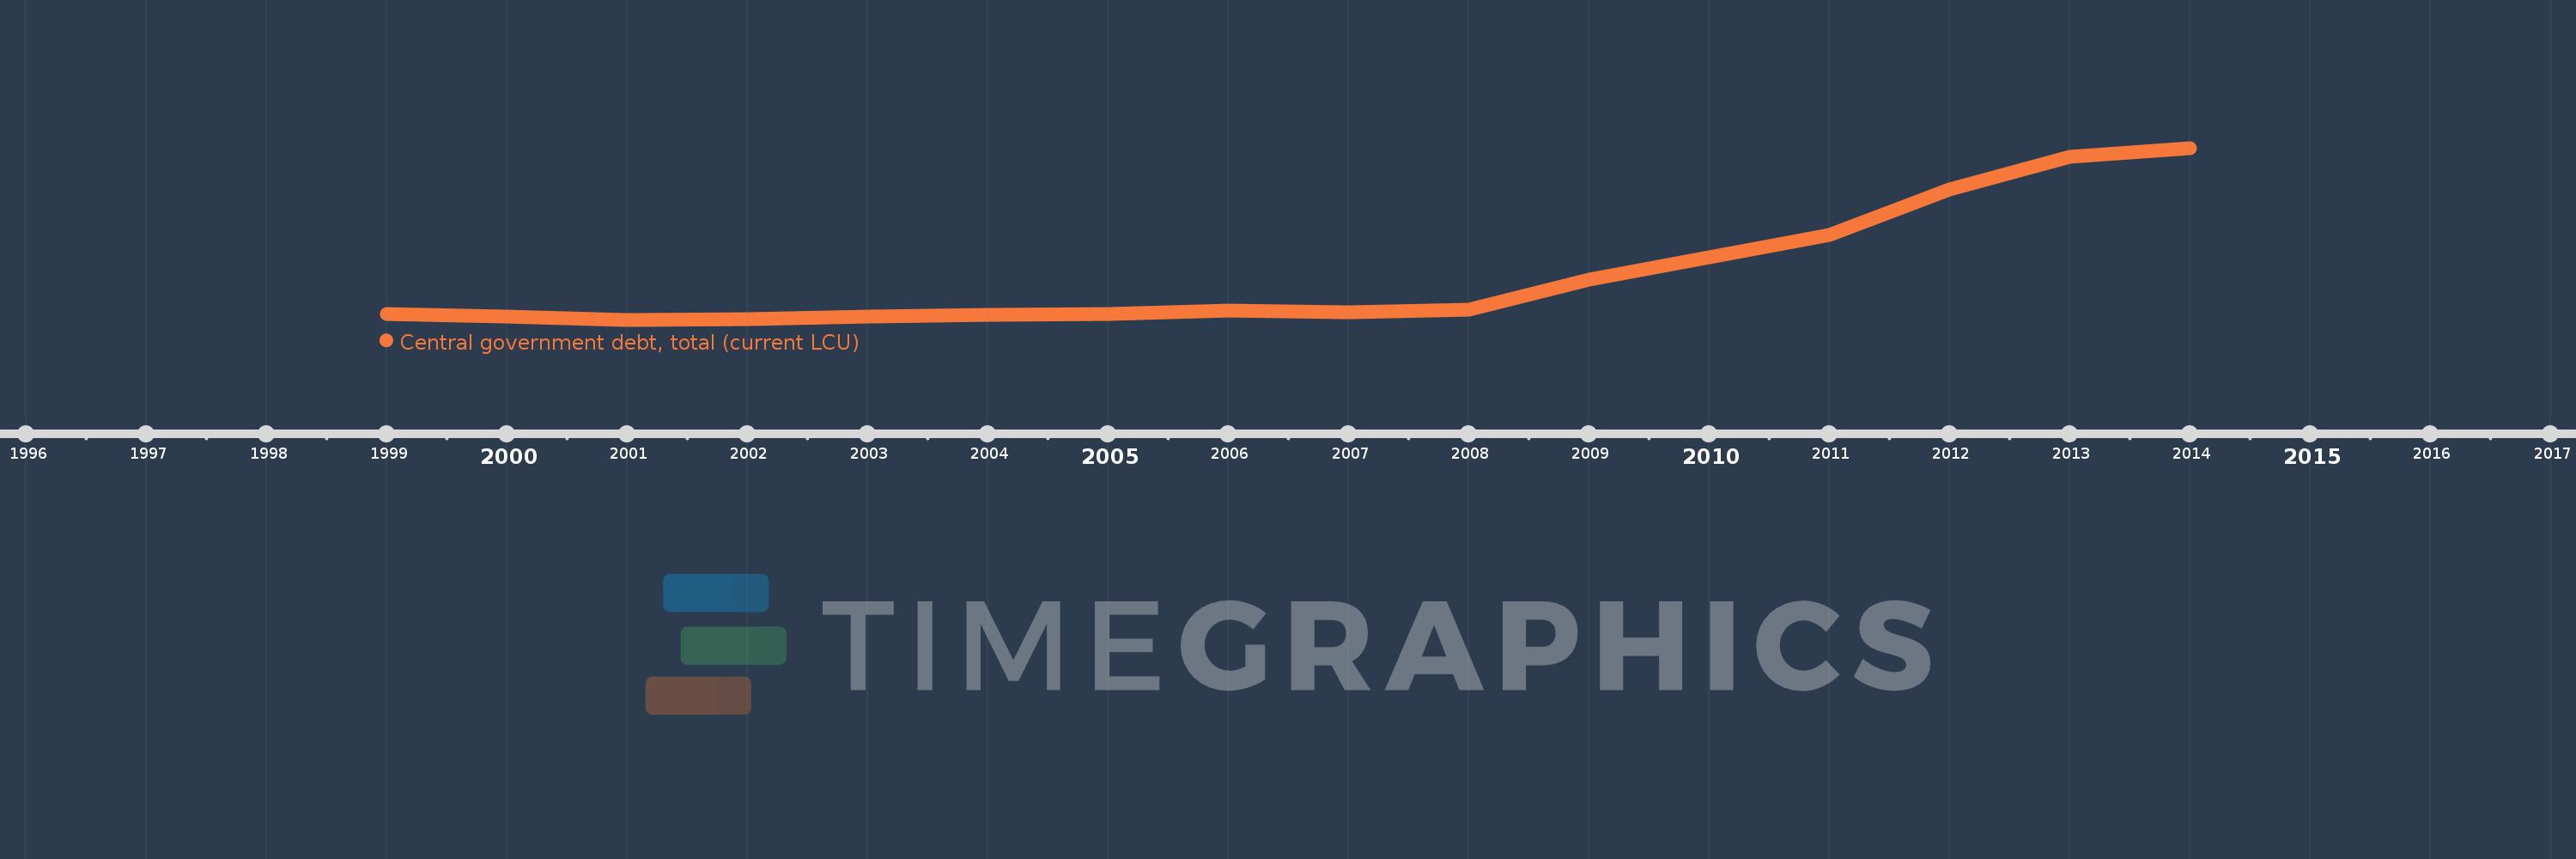
Central government debt, total (current LCU)
2014,2013,2012,2011,2010,2009,2008,2007,2006,2005,2004,2003,2002,2001,2000,1999
This statistics in other country:
Timeline:
This timeline shows a graph from 1999 to 2014 of Ireland. No data until 1998. Number of actual observations by date: 16.
Source name:
World Development Indicators
Source organization:
International Monetary Fund, Government Finance Statistics Yearbook and data files.
Categories, topics:
Public Sector
Last updated:
apr 23, 2017
Indicators value changes by year
Minimum:
41.644 bln
jan 1, 2001
Maximum:
238.627 bln
jan 1, 2014
At the date of observation
Value
Absolute change
Change from previous value
jan 1, 1999
48.154 bln
+48.154 bln
0.0%
jan 1, 2000
44.944 bln
-3.21 bln
-6.67%
jan 1, 2001
41.644 bln
-3.3 bln
-7.34%
jan 1, 2002
42.332 bln
+688.001 mln
1.65%
jan 1, 2003
45.707 bln
+3.375 bln
7.97%
jan 1, 2004
47.303 bln
+1.596 bln
3.49%
jan 1, 2005
48.215 bln
+911.999 mln
1.93%
jan 1, 2006
52.306 bln
+4.091 bln
8.48%
jan 1, 2007
49.959 bln
-2.347 bln
-4.49%
jan 1, 2008
53.111 bln
+3.152 bln
6.31%
jan 1, 2009
87.821 bln
+34.71 bln
65.35%
jan 1, 2010
113.476 bln
+25.655 bln
29.21%
jan 1, 2011
139.041 bln
+25.565 bln
22.53%
jan 1, 2012
191.325 bln
+52.284 bln
37.6%
jan 1, 2013
228.164 bln
+36.839 bln
19.25%
jan 1, 2014
238.627 bln
+10.463 bln
4.59%
Ranking of countries by current statistics by years


Comments: