29
/
en
AIzaSyAYiBZKx7MnpbEhh9jyipgxe19OcubqV5w
April 1, 2024
257089
Switzerland
CHE
true
2
1
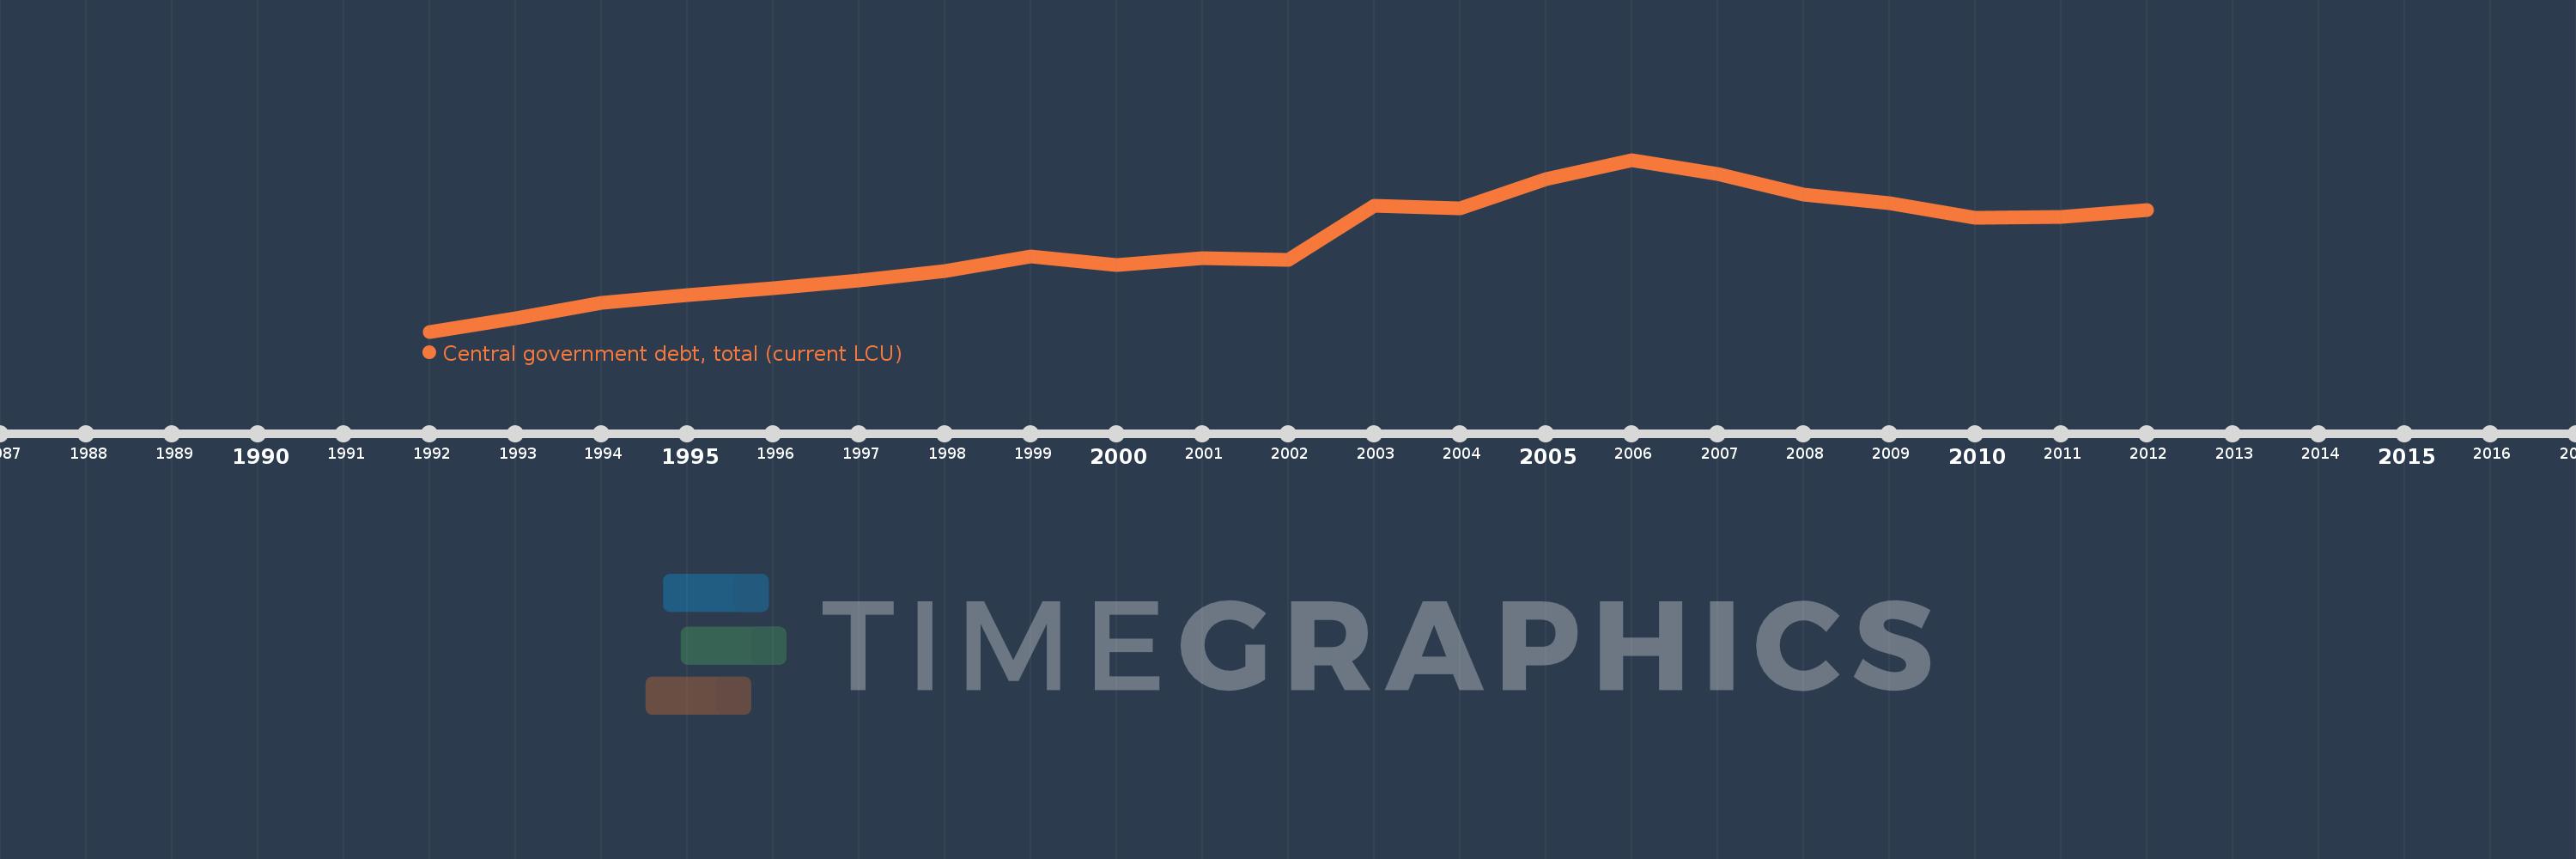
Central government debt, total (current LCU)
2012,2011,2010,2009,2008,2007,2006,2005,2004,2003,2002,2001,2000,1999,1998,1997,1996,1995,1994,1993,1992
This statistics in other country:
Timeline:
This timeline shows a graph from 1992 to 2012 of Switzerland. No data until 1991. Number of actual observations by date: 21.
Source name:
World Development Indicators
Source organization:
International Monetary Fund, Government Finance Statistics Yearbook and data files.
Categories, topics:
Public Sector
Last updated:
apr 23, 2017
Indicators value changes by year
Minimum:
43.915 bln
jan 1, 1992
Maximum:
194.145 bln
jan 1, 2006
At the date of observation
Value
Absolute change
Change from previous value
jan 1, 1992
43.915 bln
+43.915 bln
0.0%
jan 1, 1993
55.296 bln
+11.381 bln
25.92%
jan 1, 1994
69.427 bln
+14.131 bln
25.56%
jan 1, 1995
75.714 bln
+6.287 bln
9.06%
jan 1, 1996
82.152 bln
+6.438 bln
8.5%
jan 1, 1997
88.418 bln
+6.266 bln
7.63%
jan 1, 1998
97.05 bln
+8.632 bln
9.76%
jan 1, 1999
109.62 bln
+12.57 bln
12.95%
jan 1, 2000
102.254 bln
-7.366 bln
-6.72%
jan 1, 2001
108.108 bln
+5.854 bln
5.72%
jan 1, 2002
106.813 bln
-1.295 bln
-1.2%
jan 1, 2003
153.881 bln
+47.068 bln
44.07%
jan 1, 2004
151.516 bln
-2.366 bln
-1.54%
jan 1, 2005
177.482 bln
+25.966 bln
17.14%
jan 1, 2006
194.145 bln
+16.664 bln
9.39%
jan 1, 2007
181.386 bln
-12.759 bln
-6.57%
jan 1, 2008
163.917 bln
-17.47 bln
-9.63%
jan 1, 2009
156.539 bln
-7.378 bln
-4.5%
jan 1, 2010
143.333 bln
-13.206 bln
-8.44%
jan 1, 2011
144.315 bln
+982.442 mln
0.69%
jan 1, 2012
150.067 bln
+5.751 bln
3.99%
Ranking of countries by current statistics by years


Comments: