29
/
en
AIzaSyAYiBZKx7MnpbEhh9jyipgxe19OcubqV5w
April 1, 2024
286897
Zimbabwe
ZWE
true
2
1
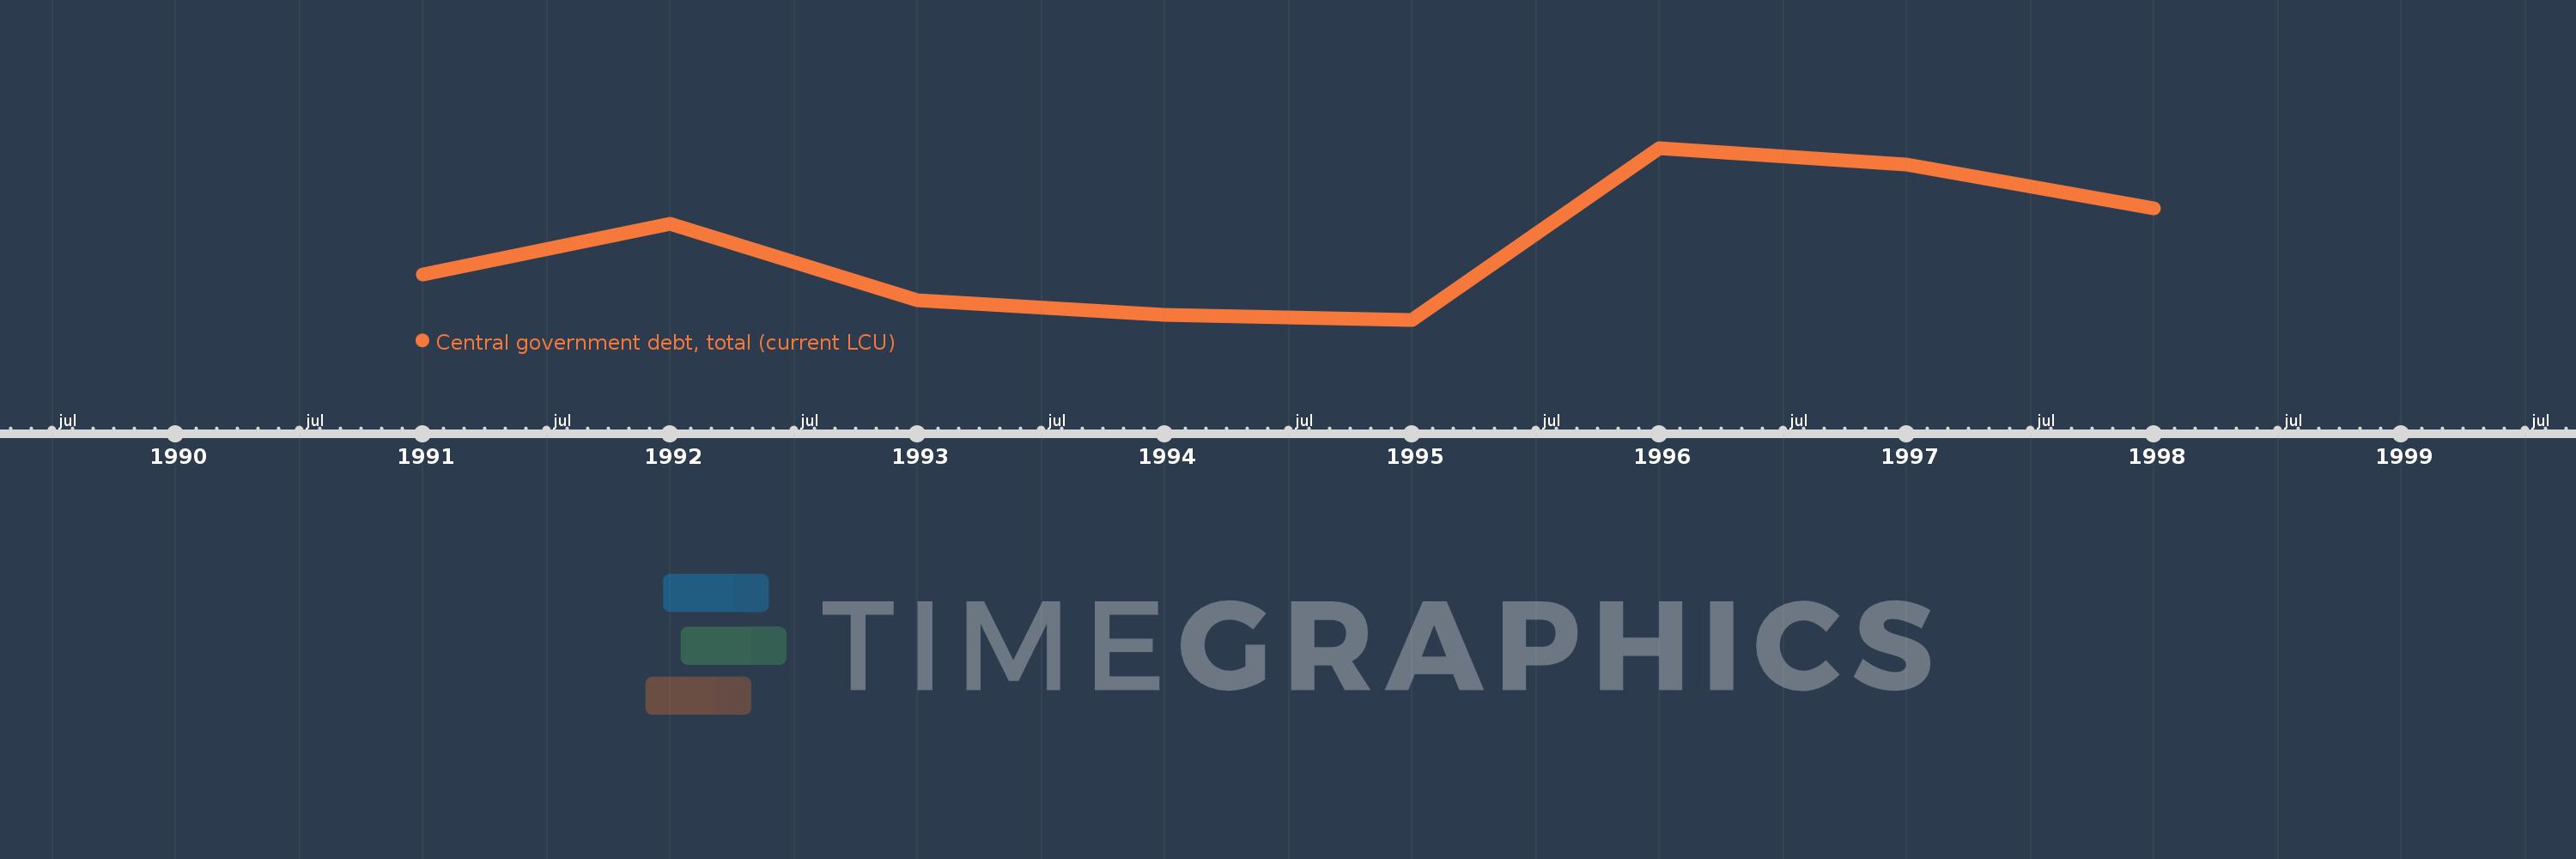
Central government debt, total (current LCU)
1998,1997,1996,1995,1994,1993,1992,1991
This statistics in other country:
Timeline:
This timeline shows a graph from 1991 to 1998 of Zimbabwe. No data until 1990. Number of actual observations by date: 8.
Source name:
World Development Indicators
Source organization:
International Monetary Fund, Government Finance Statistics Yearbook and data files.
Categories, topics:
Public Sector
Last updated:
apr 23, 2017
Indicators value changes by year
Minimum:
3.82 bln
jan 1, 1995
Maximum:
5.482 bln
jan 1, 1996
At the date of observation
Value
Absolute change
Change from previous value
jan 1, 1991
4.255 bln
+4.255 bln
0.0%
jan 1, 1992
4.744 bln
+489.562 mln
11.51%
jan 1, 1993
4.005 bln
-739.893 mln
-15.59%
jan 1, 1994
3.871 bln
-133.472 mln
-3.33%
jan 1, 1995
3.82 bln
-51.318 mln
-1.33%
jan 1, 1996
5.482 bln
+1.662 bln
43.51%
jan 1, 1997
5.319 bln
-163.168 mln
-2.98%
jan 1, 1998
4.897 bln
-422.229 mln
-7.94%
Ranking of countries by current statistics by years


Comments: