29
/
en
AIzaSyAYiBZKx7MnpbEhh9jyipgxe19OcubqV5w
April 1, 2024
95851
Burundi
BDI
true
2
1
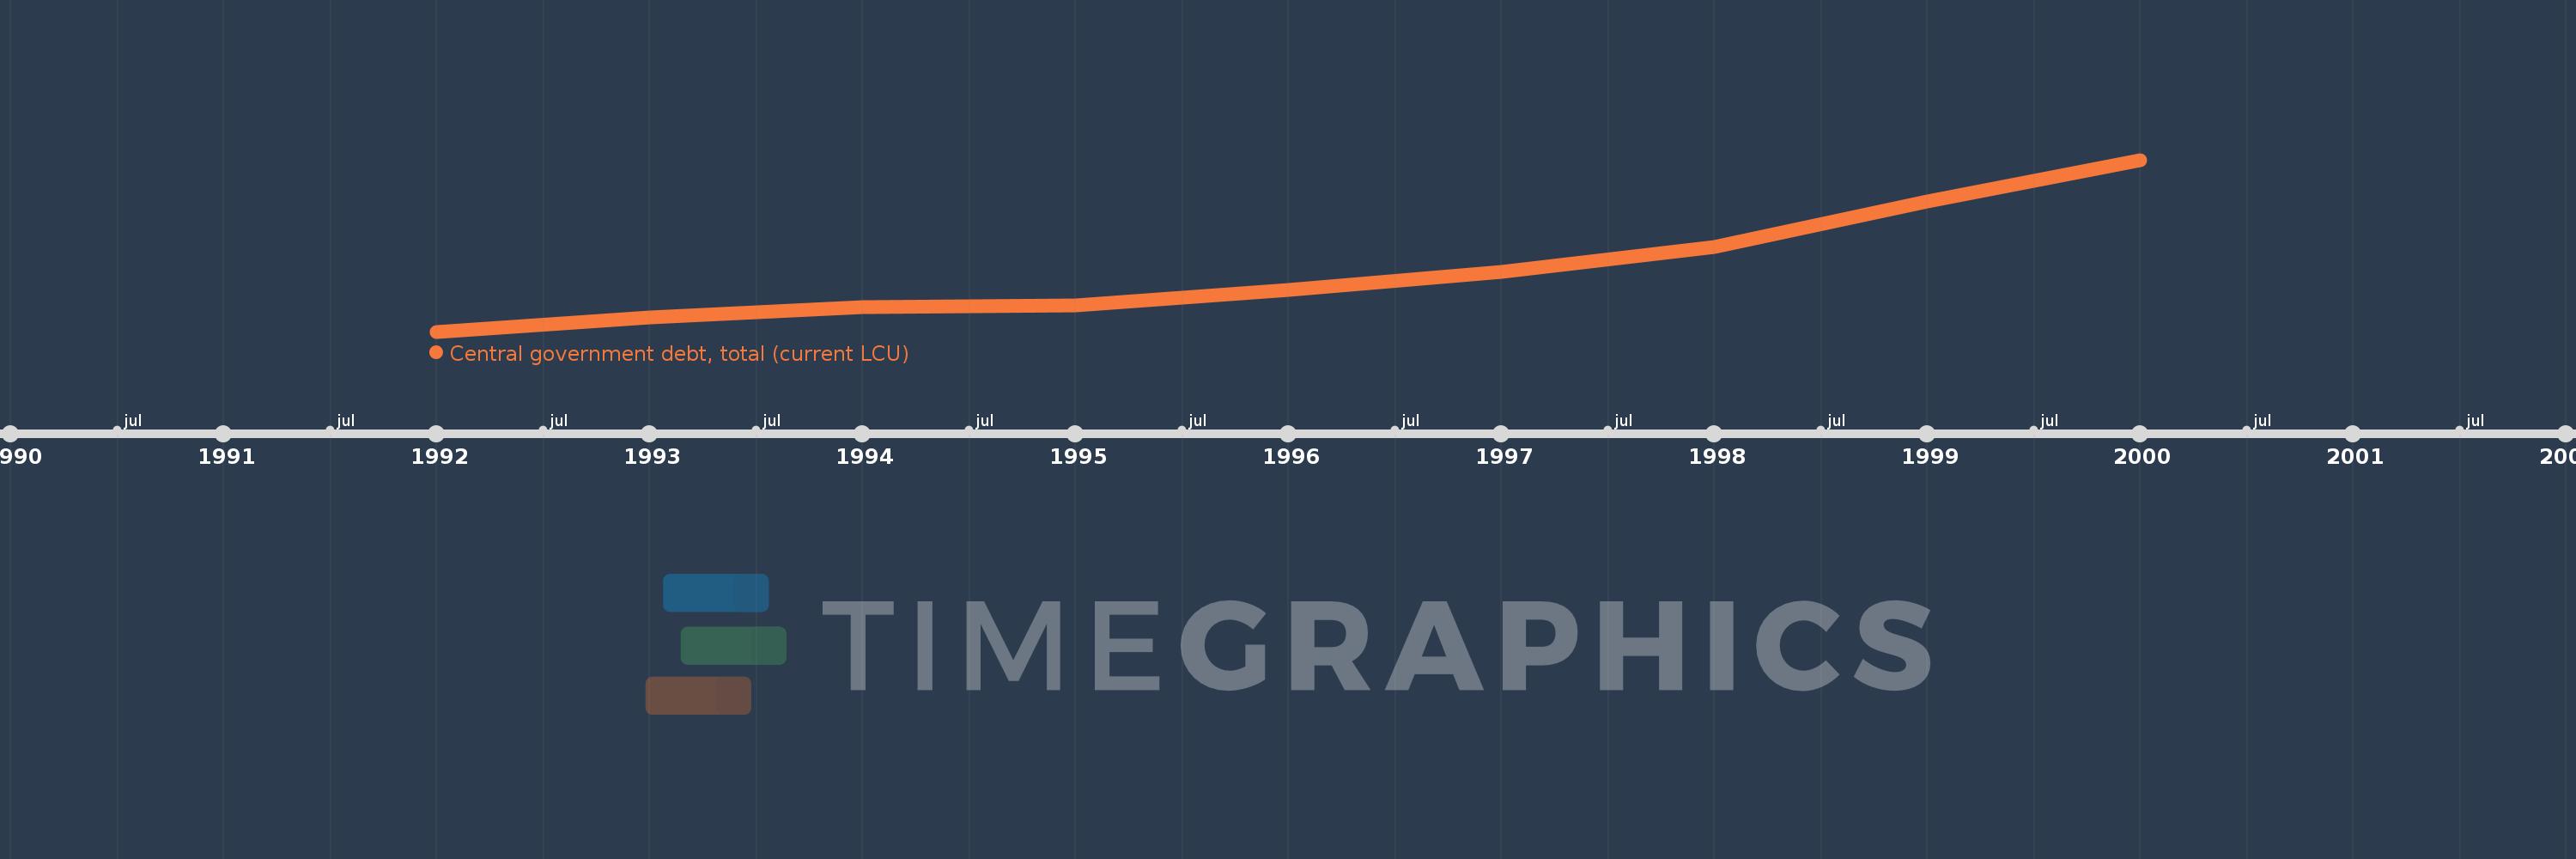
Central government debt, total (current LCU)
2000,1999,1998,1997,1996,1995,1994,1993,1992
This statistics in other country:
Timeline:
This timeline shows a graph from 1992 to 2000 of Burundi. No data until 1991. Number of actual observations by date: 9.
Source name:
World Development Indicators
Source organization:
International Monetary Fund, Government Finance Statistics Yearbook and data files.
Categories, topics:
Public Sector
Last updated:
apr 23, 2017
Indicators value changes by year
Minimum:
188.152 bln
jan 1, 1992
Maximum:
740.305 bln
jan 1, 2000
At the date of observation
Value
Absolute change
Change from previous value
jan 1, 1992
188.152 bln
+188.152 bln
0.0%
jan 1, 1993
234.605 bln
+46.453 bln
24.69%
jan 1, 1994
268.081 bln
+33.476 bln
14.27%
jan 1, 1995
273.483 bln
+5.402 bln
2.02%
jan 1, 1996
322.124 bln
+48.641 bln
17.79%
jan 1, 1997
379.121 bln
+56.997 bln
17.69%
jan 1, 1998
460.199 bln
+81.078 bln
21.39%
jan 1, 1999
605.411 bln
+145.212 bln
31.55%
jan 1, 2000
740.305 bln
+134.893 bln
22.28%
Ranking of countries by current statistics by years


Comments: