29
/
en
AIzaSyAYiBZKx7MnpbEhh9jyipgxe19OcubqV5w
April 1, 2024
141583
Greece
GRC
true
2
1
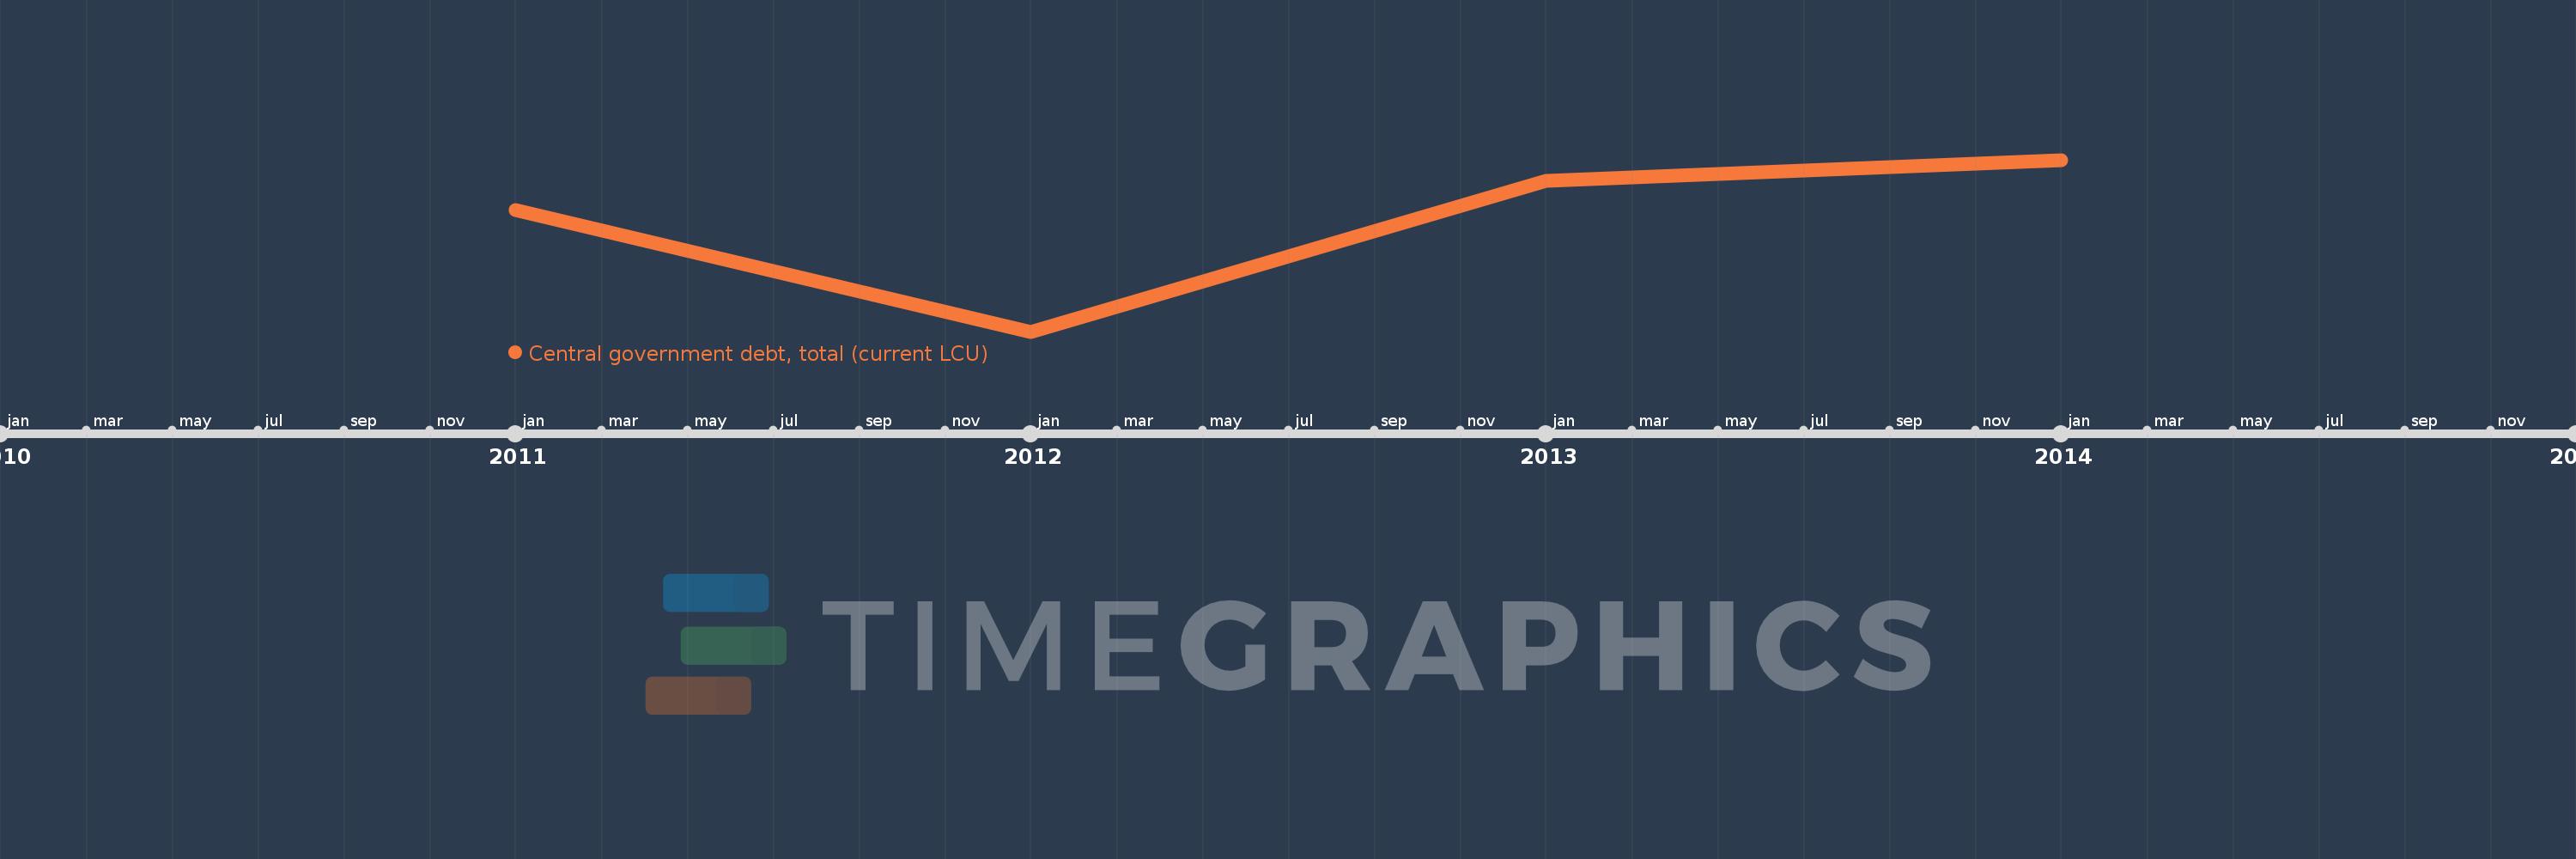
Central government debt, total (current LCU)
2014,2013,2012,2011
This statistics in other country:
Timeline:
This timeline shows a graph from 2011 to 2014 of Greece. No data until 2010. Number of actual observations by date: 4.
Source name:
World Development Indicators
Source organization:
International Monetary Fund, Government Finance Statistics Yearbook and data files.
Categories, topics:
Public Sector
Last updated:
apr 23, 2017
Indicators value changes by year
Minimum:
230.036 bln
jan 1, 2012
Maximum:
328.181 bln
jan 1, 2014
At the date of observation
Value
Absolute change
Change from previous value
jan 1, 2011
299.308 bln
+299.308 bln
0.0%
jan 1, 2012
230.036 bln
-69.272 bln
-23.14%
jan 1, 2013
316.4 bln
+86.364 bln
37.54%
jan 1, 2014
328.181 bln
+11.781 bln
3.72%
Ranking of countries by current statistics by years


Comments: