29
/
en
AIzaSyAYiBZKx7MnpbEhh9jyipgxe19OcubqV5w
April 1, 2024
266599
Trinidad and Tobago
TTO
true
2
1
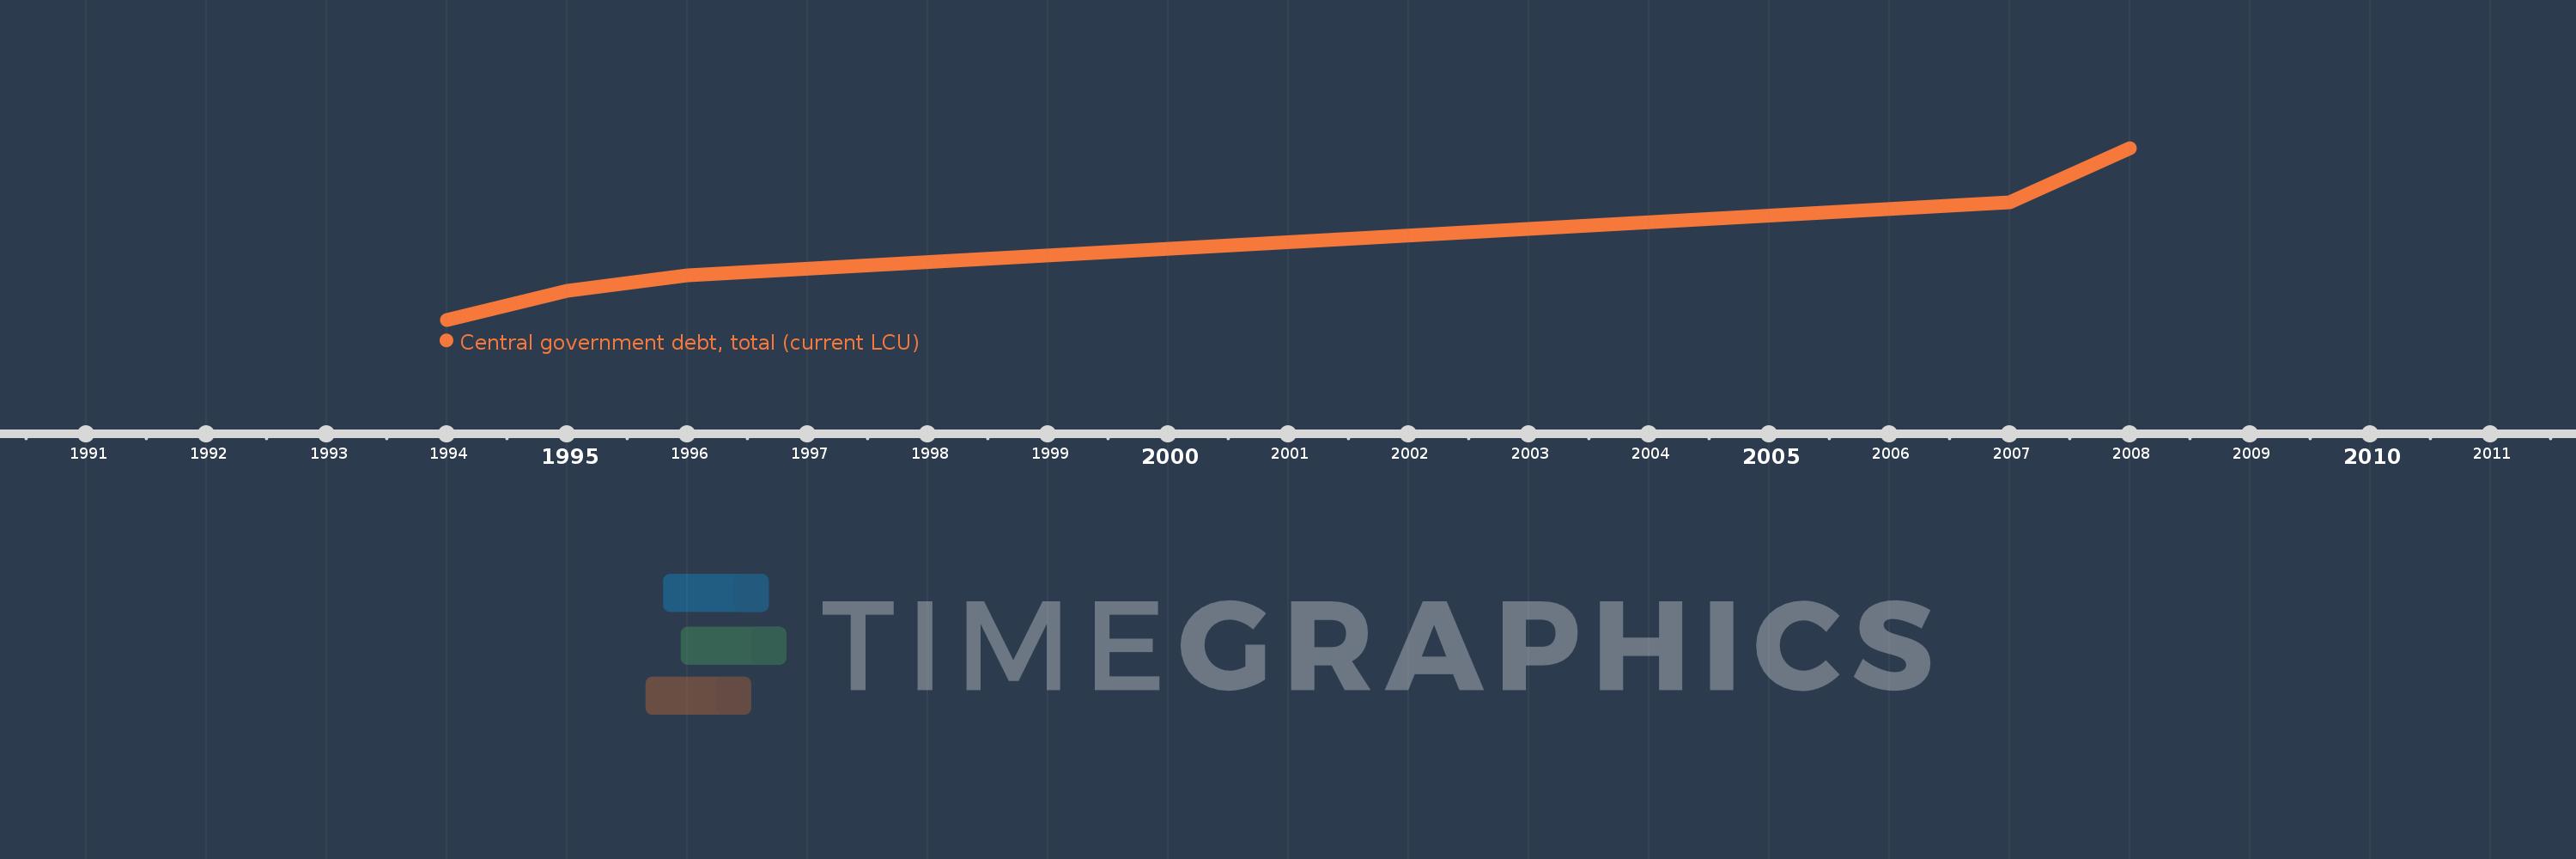
Central government debt, total (current LCU)
2008,2007,1996,1995,1994
This statistics in other country:
Timeline:
This timeline shows a graph from 1994 to 2008 of Trinidad and Tobago. No data until 1993. Number of actual observations by date: 5.
Source name:
World Development Indicators
Source organization:
International Monetary Fund, Government Finance Statistics Yearbook and data files.
Categories, topics:
Public Sector
Last updated:
apr 23, 2017
Indicators value changes by year
Minimum:
14.436 bln
jan 1, 1994
Maximum:
21.814 bln
jan 1, 2008
At the date of observation
Value
Absolute change
Change from previous value
jan 1, 1994
14.436 bln
+14.436 bln
0.0%
jan 1, 1995
15.664 bln
+1.227 bln
8.5%
jan 1, 1996
16.328 bln
+664.3 mln
4.24%
jan 1, 2007
19.483 bln
+3.156 bln
19.33%
jan 1, 2008
21.814 bln
+2.33 bln
11.96%
Ranking of countries by current statistics by years


Comments: