29
/
en
AIzaSyAYiBZKx7MnpbEhh9jyipgxe19OcubqV5w
April 1, 2024
151371
Hong Kong SAR, China
HKG
true
2
1
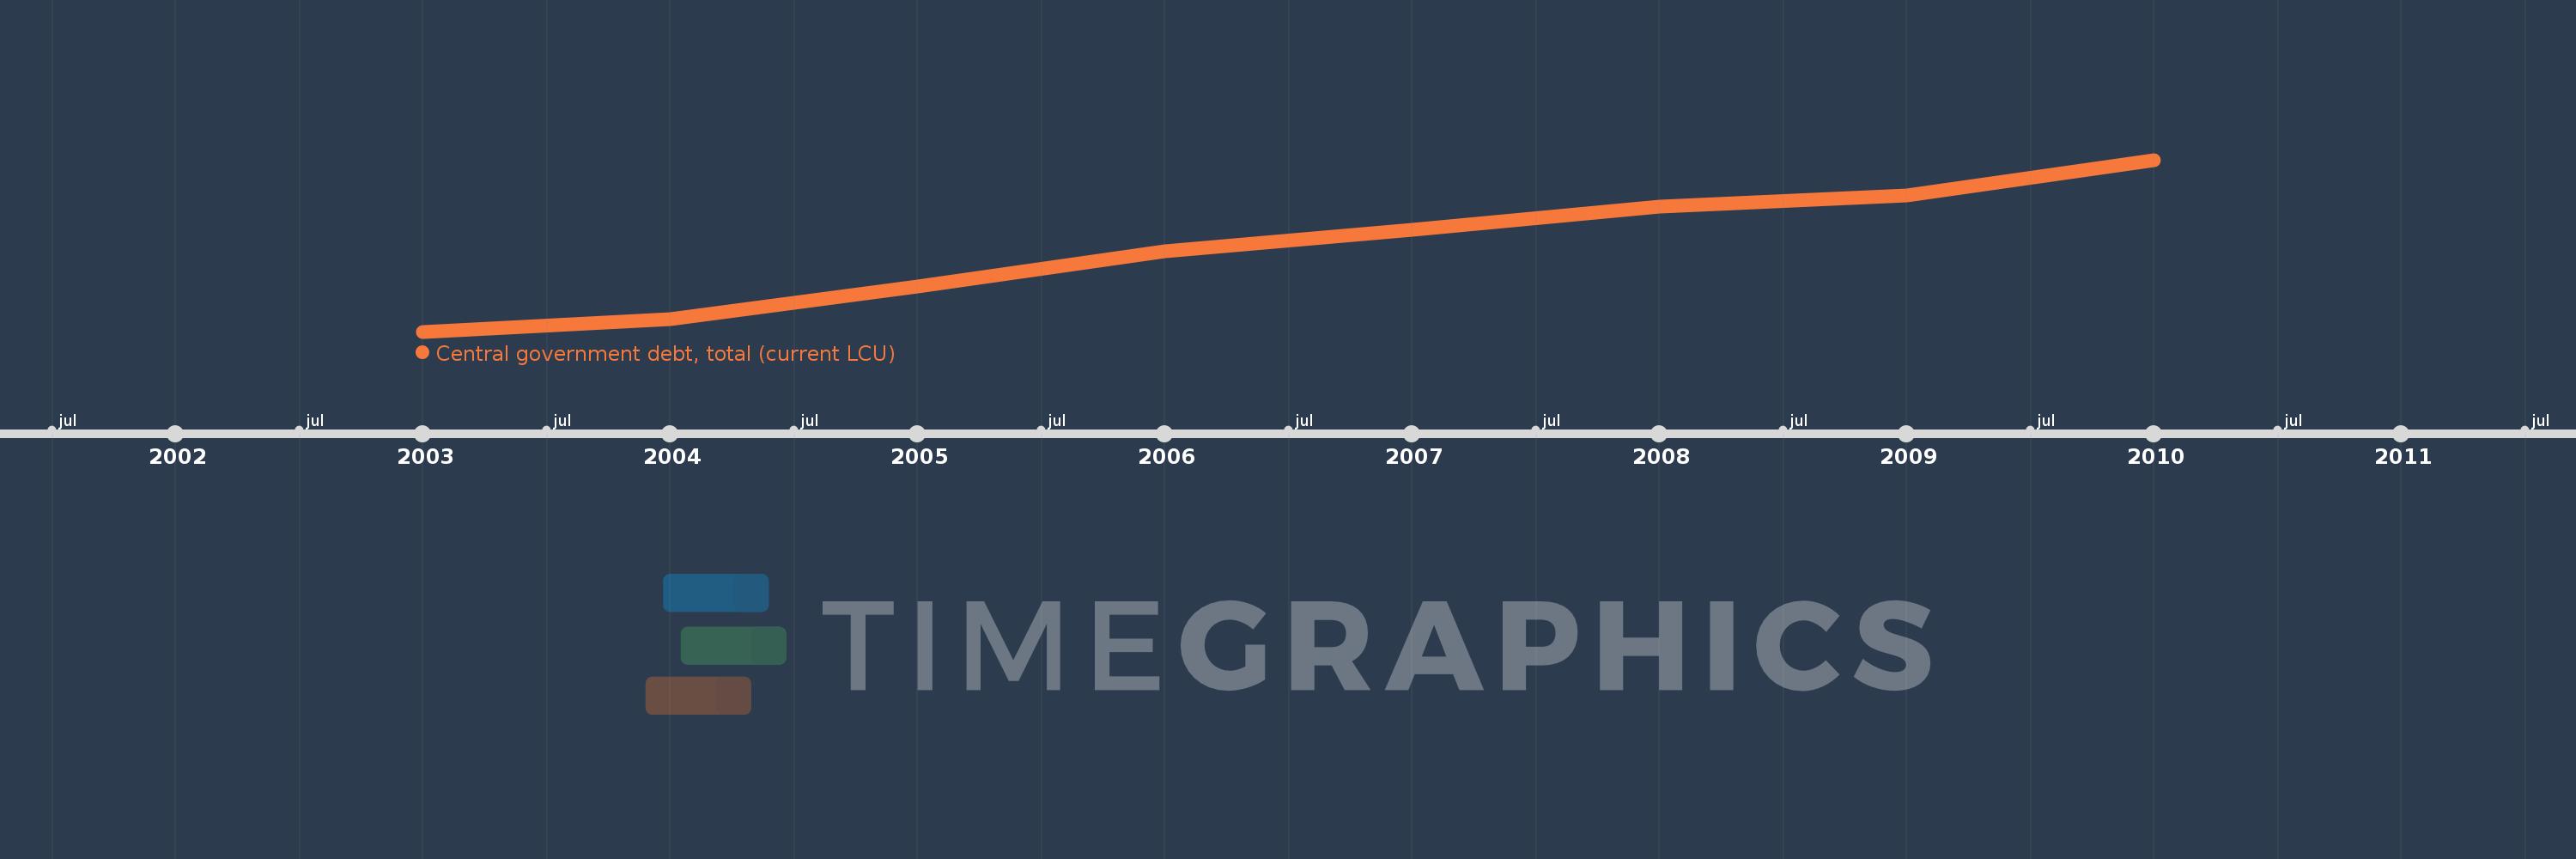
Central government debt, total (current LCU)
2010,2009,2008,2007,2006,2005,2004,2003
This statistics in other country:
Timeline:
This timeline shows a graph from 2003 to 2010 of Hong Kong SAR, China. No data until 2002. Number of actual observations by date: 8.
Source name:
World Development Indicators
Source organization:
International Monetary Fund, Government Finance Statistics Yearbook and data files.
Categories, topics:
Public Sector
Last updated:
apr 23, 2017
Indicators value changes by year
Minimum:
353.337 bln
jan 1, 2003
Maximum:
551.234 bln
jan 1, 2010
At the date of observation
Value
Absolute change
Change from previous value
jan 1, 2003
353.337 bln
+353.337 bln
0.0%
jan 1, 2004
367.665 bln
+14.328 bln
4.06%
jan 1, 2005
405.749 bln
+38.084 bln
10.36%
jan 1, 2006
445.905 bln
+40.156 bln
9.9%
jan 1, 2007
470.267 bln
+24.362 bln
5.46%
jan 1, 2008
497.069 bln
+26.802 bln
5.7%
jan 1, 2009
510.374 bln
+13.305 bln
2.68%
jan 1, 2010
551.234 bln
+40.86 bln
8.01%
Ranking of countries by current statistics by years


Comments: