29
/
en
AIzaSyAYiBZKx7MnpbEhh9jyipgxe19OcubqV5w
April 1, 2024
162262
Jamaica
JAM
true
2
1
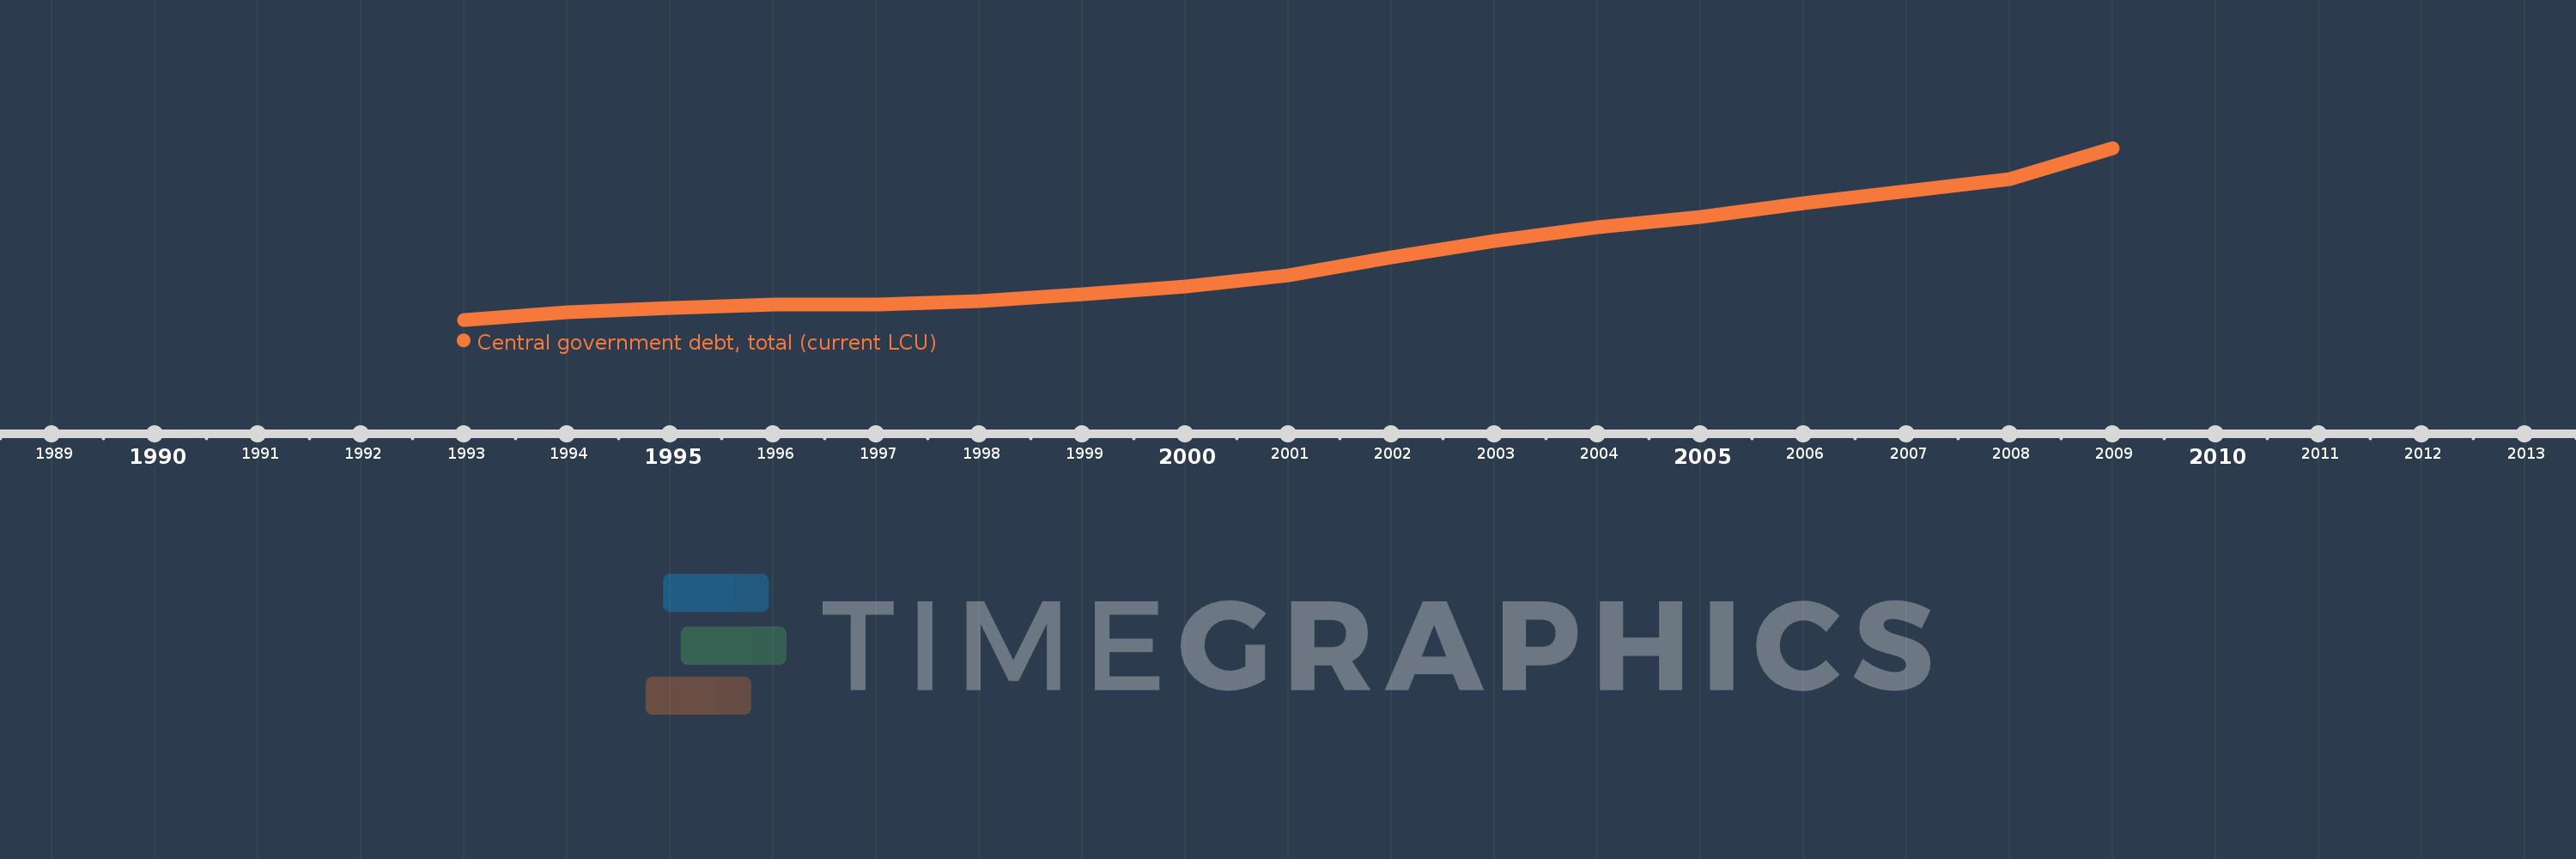
Central government debt, total (current LCU)
2009,2008,2007,2006,2005,2004,2003,2002,2001,2000,1999,1998,1997,1996,1995,1994,1993
This statistics in other country:
Timeline:
This timeline shows a graph from 1993 to 2009 of Jamaica. No data until 1992. Number of actual observations by date: 17.
Source name:
World Development Indicators
Source organization:
International Monetary Fund, Government Finance Statistics Yearbook and data files.
Categories, topics:
Public Sector
Last updated:
apr 23, 2017
Indicators value changes by year
Minimum:
97.755 bln
jan 1, 1993
Maximum:
1.201 trl
jan 1, 2009
At the date of observation
Value
Absolute change
Change from previous value
jan 1, 1993
97.755 bln
+97.755 bln
0.0%
jan 1, 1994
144.873 bln
+47.119 bln
48.2%
jan 1, 1995
170.807 bln
+25.934 bln
17.9%
jan 1, 1996
193.843 bln
+23.037 bln
13.49%
jan 1, 1997
196.364 bln
+2.52 bln
1.3%
jan 1, 1998
219.215 bln
+22.851 bln
11.64%
jan 1, 1999
262.303 bln
+43.088 bln
19.66%
jan 1, 2000
308.688 bln
+46.385 bln
17.68%
jan 1, 2001
380.641 bln
+71.953 bln
23.31%
jan 1, 2002
497.083 bln
+116.442 bln
30.59%
jan 1, 2003
601.241 bln
+104.159 bln
20.95%
jan 1, 2004
693.887 bln
+92.645 bln
15.41%
jan 1, 2005
759.697 bln
+65.81 bln
9.48%
jan 1, 2006
847.351 bln
+87.654 bln
11.54%
jan 1, 2007
923.124 bln
+75.773 bln
8.94%
jan 1, 2008
1.001 trl
+77.556 bln
8.4%
jan 1, 2009
1.201 trl
+200.41 bln
20.03%
Ranking of countries by current statistics by years


Comments: