29
/
en
AIzaSyAYiBZKx7MnpbEhh9jyipgxe19OcubqV5w
April 1, 2024
117674
Czech Republic
CZE
true
2
1
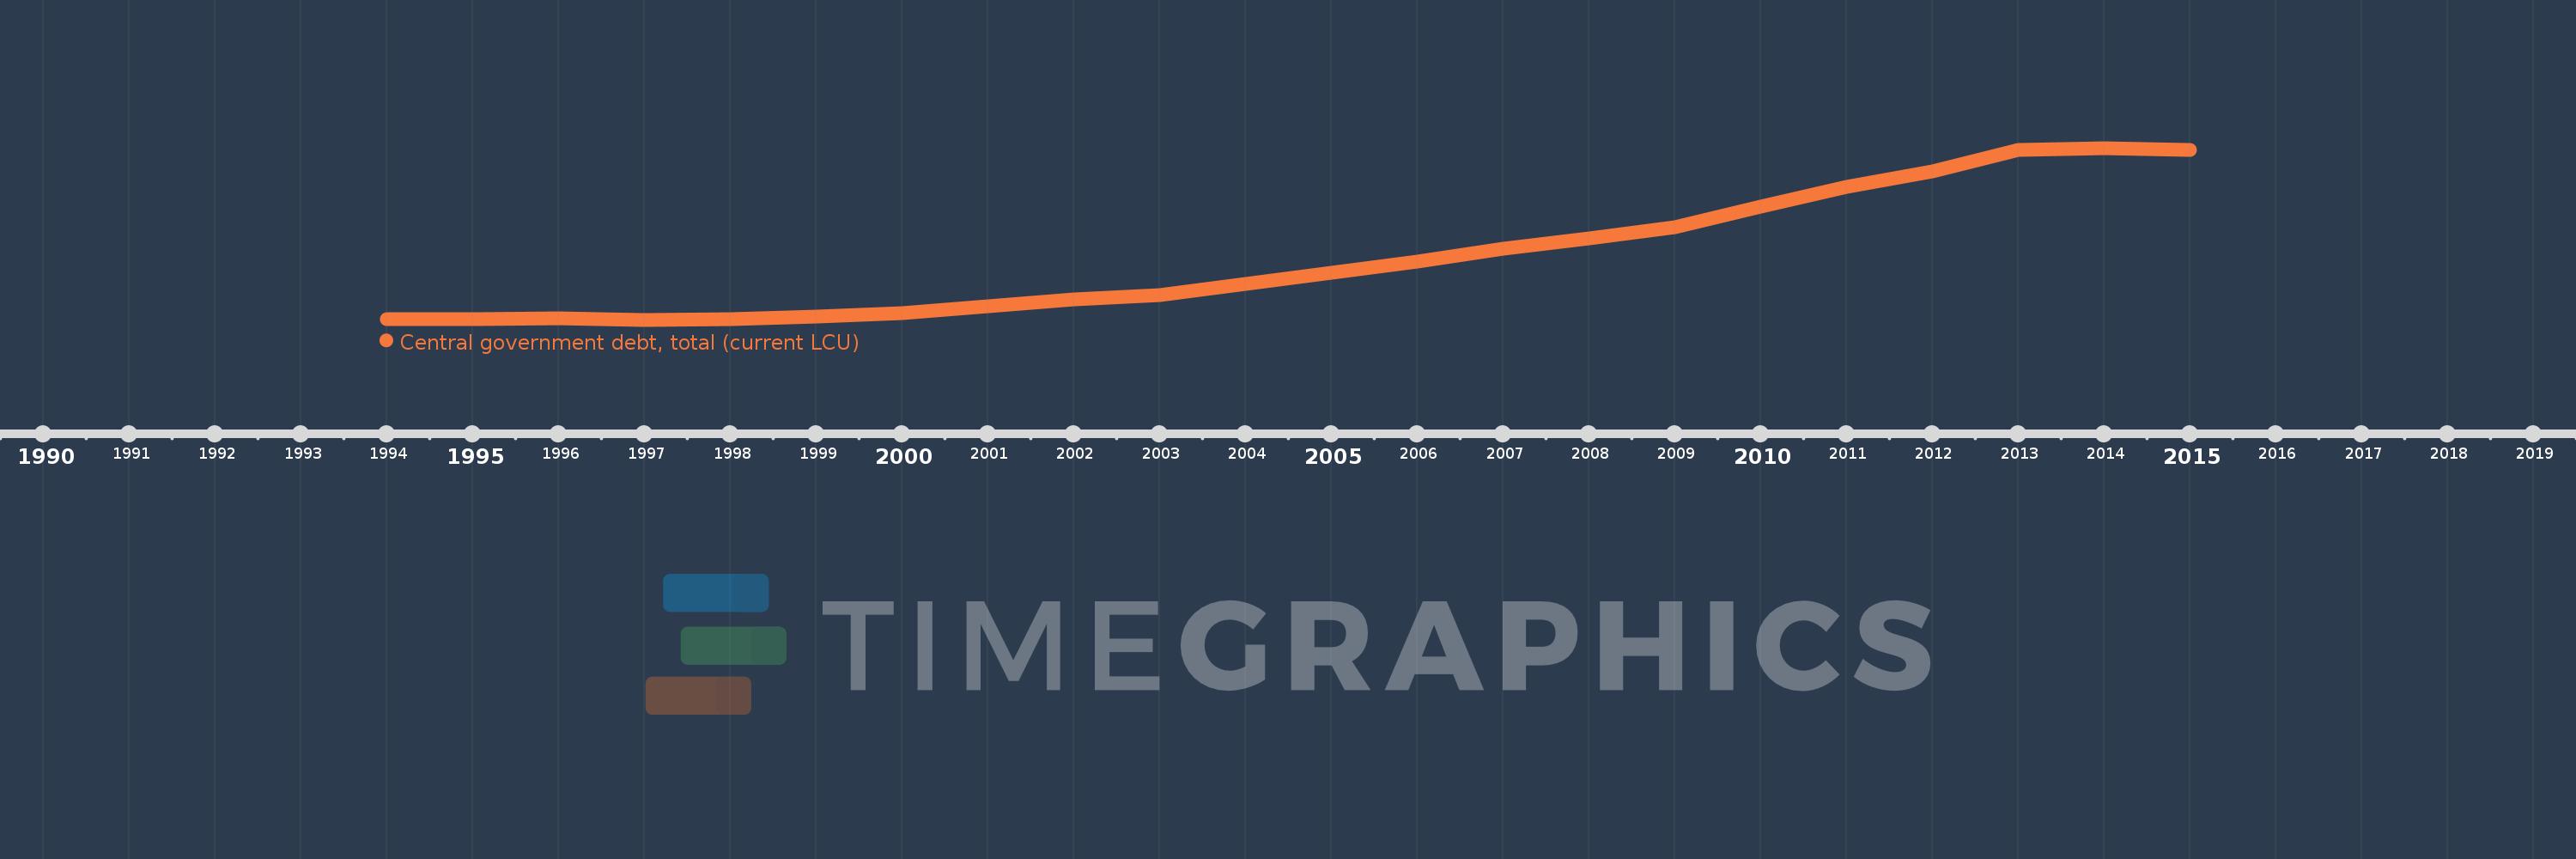
Central government debt, total (current LCU)
2015,2014,2013,2012,2011,2010,2009,2008,2007,2006,2005,2004,2003,2002,2001,2000,1999,1998,1997,1996,1995,1994
This statistics in other country:
Timeline:
This timeline shows a graph from 1994 to 2015 of Czech Republic. No data until 1993. Number of actual observations by date: 22.
Source name:
World Development Indicators
Source organization:
International Monetary Fund, Government Finance Statistics Yearbook and data files.
Categories, topics:
Public Sector
Last updated:
apr 23, 2017
Indicators value changes by year
Minimum:
185.323 bln
jan 1, 1997
Maximum:
1.664 trl
jan 1, 2014
At the date of observation
Value
Absolute change
Change from previous value
jan 1, 1994
188.727 bln
+188.727 bln
0.0%
jan 1, 1995
194.159 bln
+5.432 bln
2.88%
jan 1, 1996
194.897 bln
+738.0 mln
0.38%
jan 1, 1997
185.323 bln
-9.574 bln
-4.91%
jan 1, 1998
191.387 bln
+6.064 bln
3.27%
jan 1, 1999
209.844 bln
+18.457 bln
9.64%
jan 1, 2000
244.058 bln
+34.214 bln
16.3%
jan 1, 2001
300.028 bln
+55.97 bln
22.93%
jan 1, 2002
364.209 bln
+64.181 bln
21.39%
jan 1, 2003
396.056 bln
+31.847 bln
8.74%
jan 1, 2004
491.056 bln
+95.0 bln
23.99%
jan 1, 2005
589.009 bln
+97.953 bln
19.95%
jan 1, 2006
686.575 bln
+97.566 bln
16.56%
jan 1, 2007
794.836 bln
+108.261 bln
15.77%
jan 1, 2008
886.098 bln
+91.262 bln
11.48%
jan 1, 2009
980.389 bln
+94.291 bln
10.64%
jan 1, 2010
1.16 trl
+180.075 bln
18.37%
jan 1, 2011
1.327 trl
+166.241 bln
14.33%
jan 1, 2012
1.463 trl
+135.885 bln
10.24%
jan 1, 2013
1.65 trl
+187.34 bln
12.81%
jan 1, 2014
1.664 trl
+14.44 bln
0.88%
jan 1, 2015
1.648 trl
-16.086 bln
-0.97%
Ranking of countries by current statistics by years


Comments: