29
/
en
AIzaSyAYiBZKx7MnpbEhh9jyipgxe19OcubqV5w
April 1, 2024
153336
Iceland
ISL
true
2
1
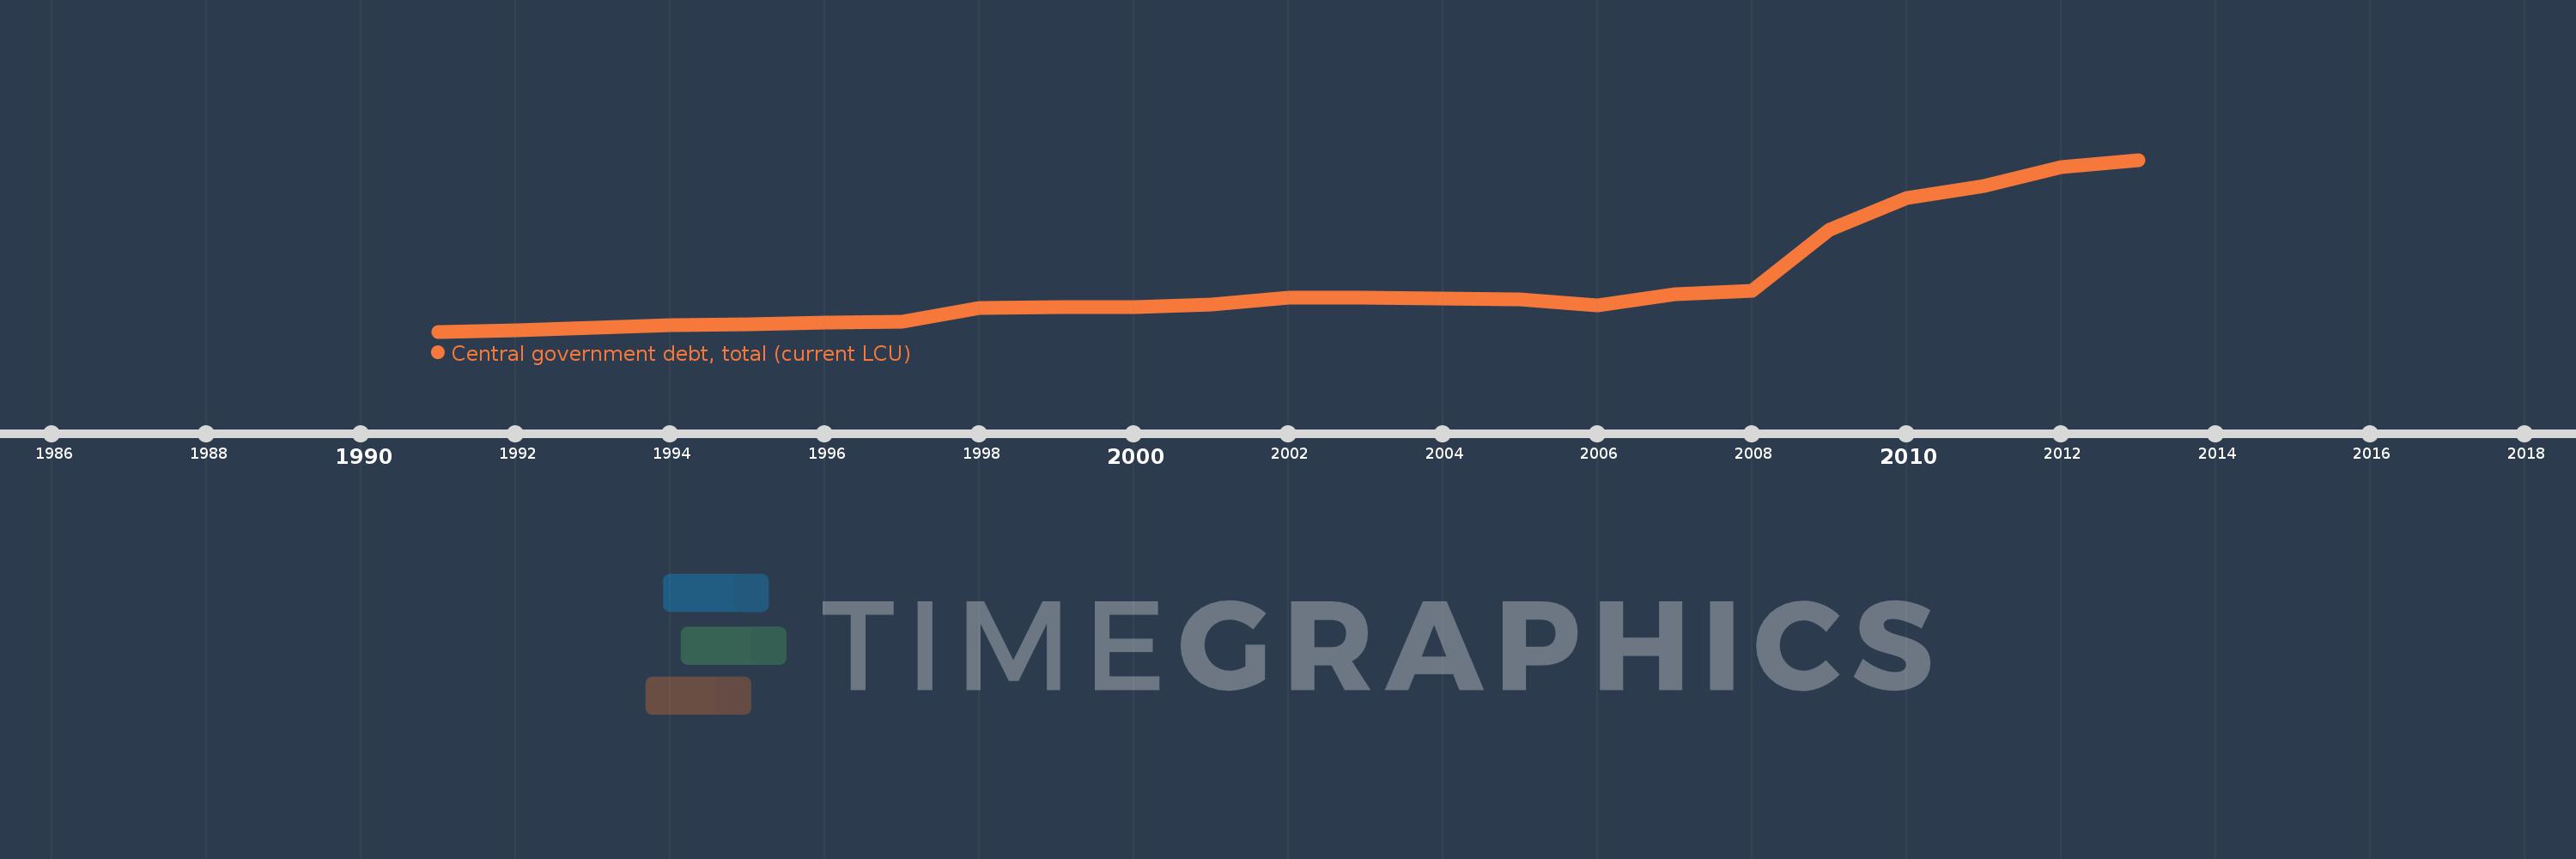
Central government debt, total (current LCU)
2013,2012,2011,2010,2009,2008,2007,2006,2005,2004,2003,2002,2001,2000,1999,1998,1997,1996,1995,1994,1993,1992,1991
This statistics in other country:
Timeline:
This timeline shows a graph from 1991 to 2013 of Iceland. No data until 1990. Number of actual observations by date: 23.
Source name:
World Development Indicators
Source organization:
International Monetary Fund, Government Finance Statistics Yearbook and data files.
Categories, topics:
Public Sector
Last updated:
apr 23, 2017
Indicators value changes by year
Minimum:
112.784 bln
jan 1, 1991
Maximum:
1.998 trl
jan 1, 2013
At the date of observation
Value
Absolute change
Change from previous value
jan 1, 1991
112.784 bln
+112.784 bln
0.0%
jan 1, 1992
127.656 bln
+14.872 bln
13.19%
jan 1, 1993
153.412 bln
+25.756 bln
20.18%
jan 1, 1994
181.03 bln
+27.618 bln
18.0%
jan 1, 1995
197.106 bln
+16.076 bln
8.88%
jan 1, 1996
213.575 bln
+16.469 bln
8.36%
jan 1, 1997
225.677 bln
+12.102 bln
5.67%
jan 1, 1998
367.471 bln
+141.794 bln
62.83%
jan 1, 1999
381.213 bln
+13.742 bln
3.74%
jan 1, 2000
384.359 bln
+3.146 bln
0.83%
jan 1, 2001
413.376 bln
+29.018 bln
7.55%
jan 1, 2002
483.648 bln
+70.271 bln
17.0%
jan 1, 2003
480.876 bln
-2.772 bln
-0.57%
jan 1, 2004
477.334 bln
-3.542 bln
-0.74%
jan 1, 2005
468.517 bln
-8.817 bln
-1.85%
jan 1, 2006
404.28 bln
-64.237 bln
-13.71%
jan 1, 2007
518.384 bln
+114.104 bln
28.22%
jan 1, 2008
562.037 bln
+43.654 bln
8.42%
jan 1, 2009
1.227 trl
+665.289 bln
118.37%
jan 1, 2010
1.578 trl
+350.261 bln
28.54%
jan 1, 2011
1.713 trl
+135.614 bln
8.6%
jan 1, 2012
1.922 trl
+208.841 bln
12.19%
jan 1, 2013
1.998 trl
+75.598 bln
3.93%
Ranking of countries by current statistics by years


Comments: