29
/
en
AIzaSyAYiBZKx7MnpbEhh9jyipgxe19OcubqV5w
April 1, 2024
195243
Mexico
MEX
true
2
1
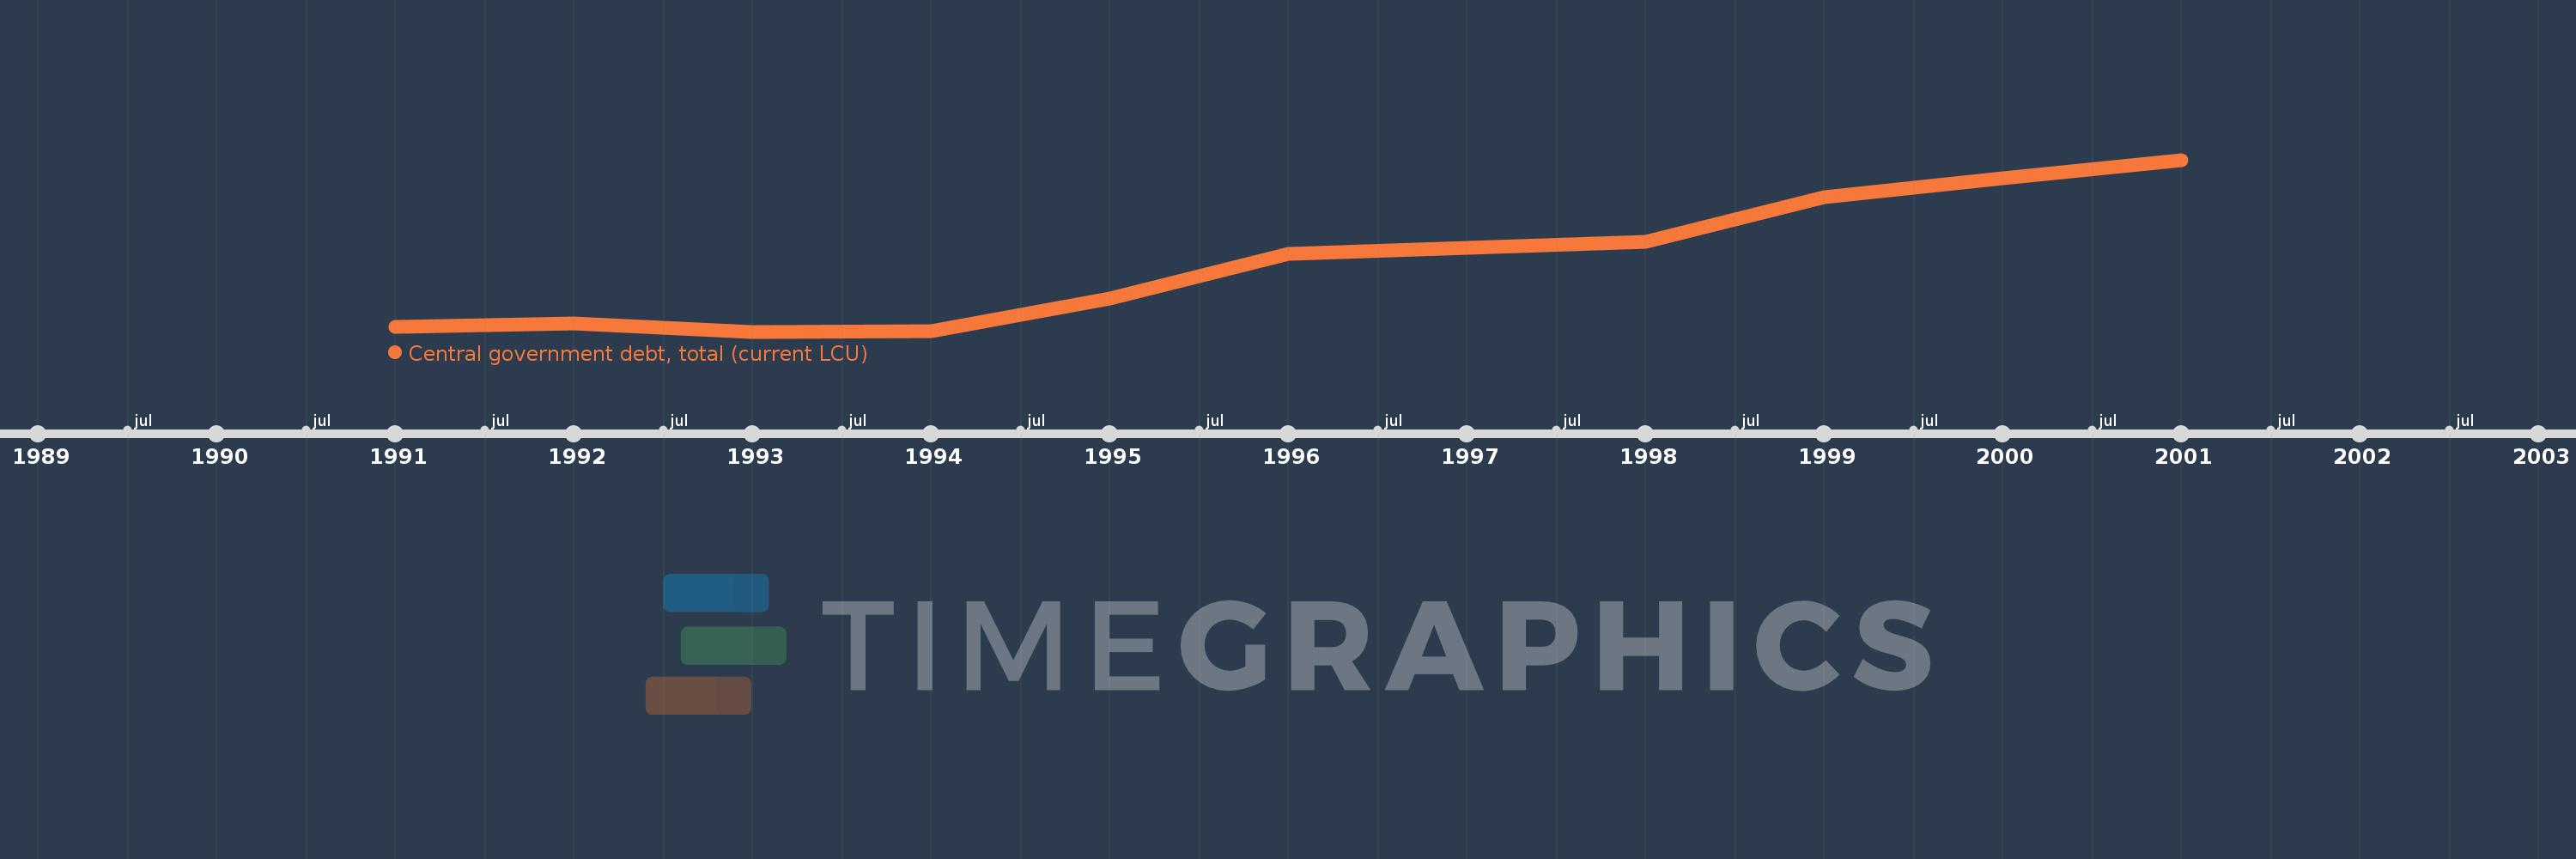
Central government debt, total (current LCU)
2001,2000,1999,1998,1997,1996,1995,1994,1993,1992,1991
This statistics in other country:
Timeline:
This timeline shows a graph from 1991 to 2001 of Mexico. No data until 1990. Number of actual observations by date: 11.
Source name:
World Development Indicators
Source organization:
International Monetary Fund, Government Finance Statistics Yearbook and data files.
Categories, topics:
Public Sector
Last updated:
apr 23, 2017
Indicators value changes by year
Minimum:
316.355 bln
jan 1, 1993
Maximum:
1.276 trl
jan 1, 2001
At the date of observation
Value
Absolute change
Change from previous value
jan 1, 1991
342.615 bln
+342.615 bln
0.0%
jan 1, 1992
361.235 bln
+18.62 bln
5.43%
jan 1, 1993
316.355 bln
-44.88 bln
-12.42%
jan 1, 1994
317.871 bln
+1.516 bln
0.48%
jan 1, 1995
501.585 bln
+183.714 bln
57.8%
jan 1, 1996
750.262 bln
+248.677 bln
49.58%
jan 1, 1997
785.977 bln
+35.715 bln
4.76%
jan 1, 1998
818.227 bln
+32.25 bln
4.1%
jan 1, 1999
1.07 trl
+251.719 bln
30.76%
jan 1, 2000
1.176 trl
+105.582 bln
9.87%
jan 1, 2001
1.276 trl
+100.923 bln
8.59%
Ranking of countries by current statistics by years


Comments: