29
/
en
AIzaSyAYiBZKx7MnpbEhh9jyipgxe19OcubqV5w
April 1, 2024
120707
Dominica
DMA
true
2
1
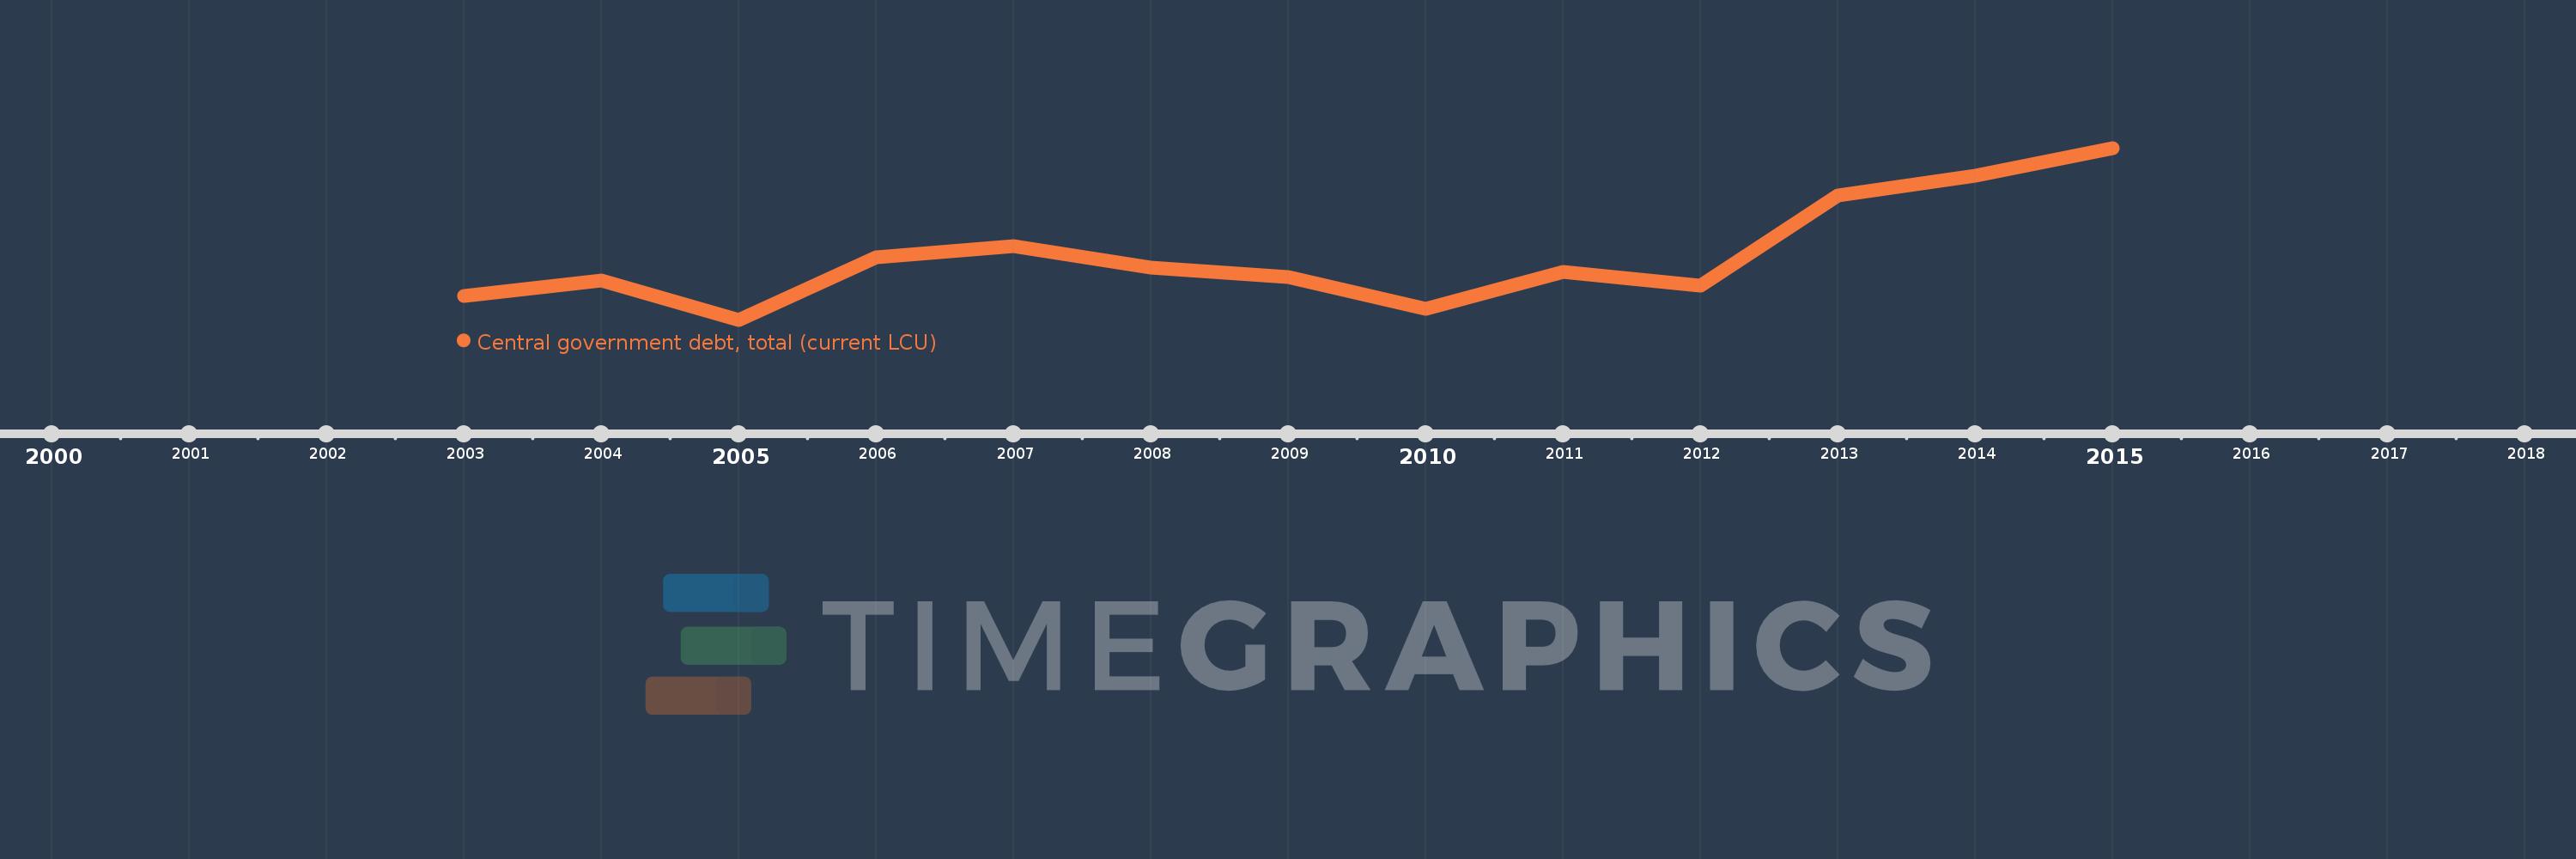
Central government debt, total (current LCU)
2015,2014,2013,2012,2011,2010,2009,2008,2007,2006,2005,2004,2003
This statistics in other country:
Timeline:
This timeline shows a graph from 2003 to 2015 of Dominica. No data until 2002. Number of actual observations by date: 13.
Source name:
World Development Indicators
Source organization:
International Monetary Fund, Government Finance Statistics Yearbook and data files.
Categories, topics:
Public Sector
Last updated:
apr 23, 2017
Indicators value changes by year
Minimum:
694.3 mln
jan 1, 2005
Maximum:
917.22 mln
jan 1, 2015
At the date of observation
Value
Absolute change
Change from previous value
jan 1, 2003
725.1 mln
+725.1 mln
0.0%
jan 1, 2004
745.3 mln
+20.2 mln
2.79%
jan 1, 2005
694.3 mln
-51.0 mln
-6.84%
jan 1, 2006
775.1 mln
+80.8 mln
11.64%
jan 1, 2007
789.3 mln
+14.2 mln
1.83%
jan 1, 2008
762.1 mln
-27.2 mln
-3.45%
jan 1, 2009
749.2 mln
-12.9 mln
-1.69%
jan 1, 2010
708.94 mln
-40.26 mln
-5.37%
jan 1, 2011
755.89 mln
+46.95 mln
6.62%
jan 1, 2012
739.09 mln
-16.8 mln
-2.22%
jan 1, 2013
855.72 mln
+116.63 mln
15.78%
jan 1, 2014
880.96 mln
+25.24 mln
2.95%
jan 1, 2015
917.22 mln
+36.26 mln
4.12%
Ranking of countries by current statistics by years


Comments: