29
/
en
AIzaSyAYiBZKx7MnpbEhh9jyipgxe19OcubqV5w
April 1, 2024
197216
Moldova
MDA
true
2
1
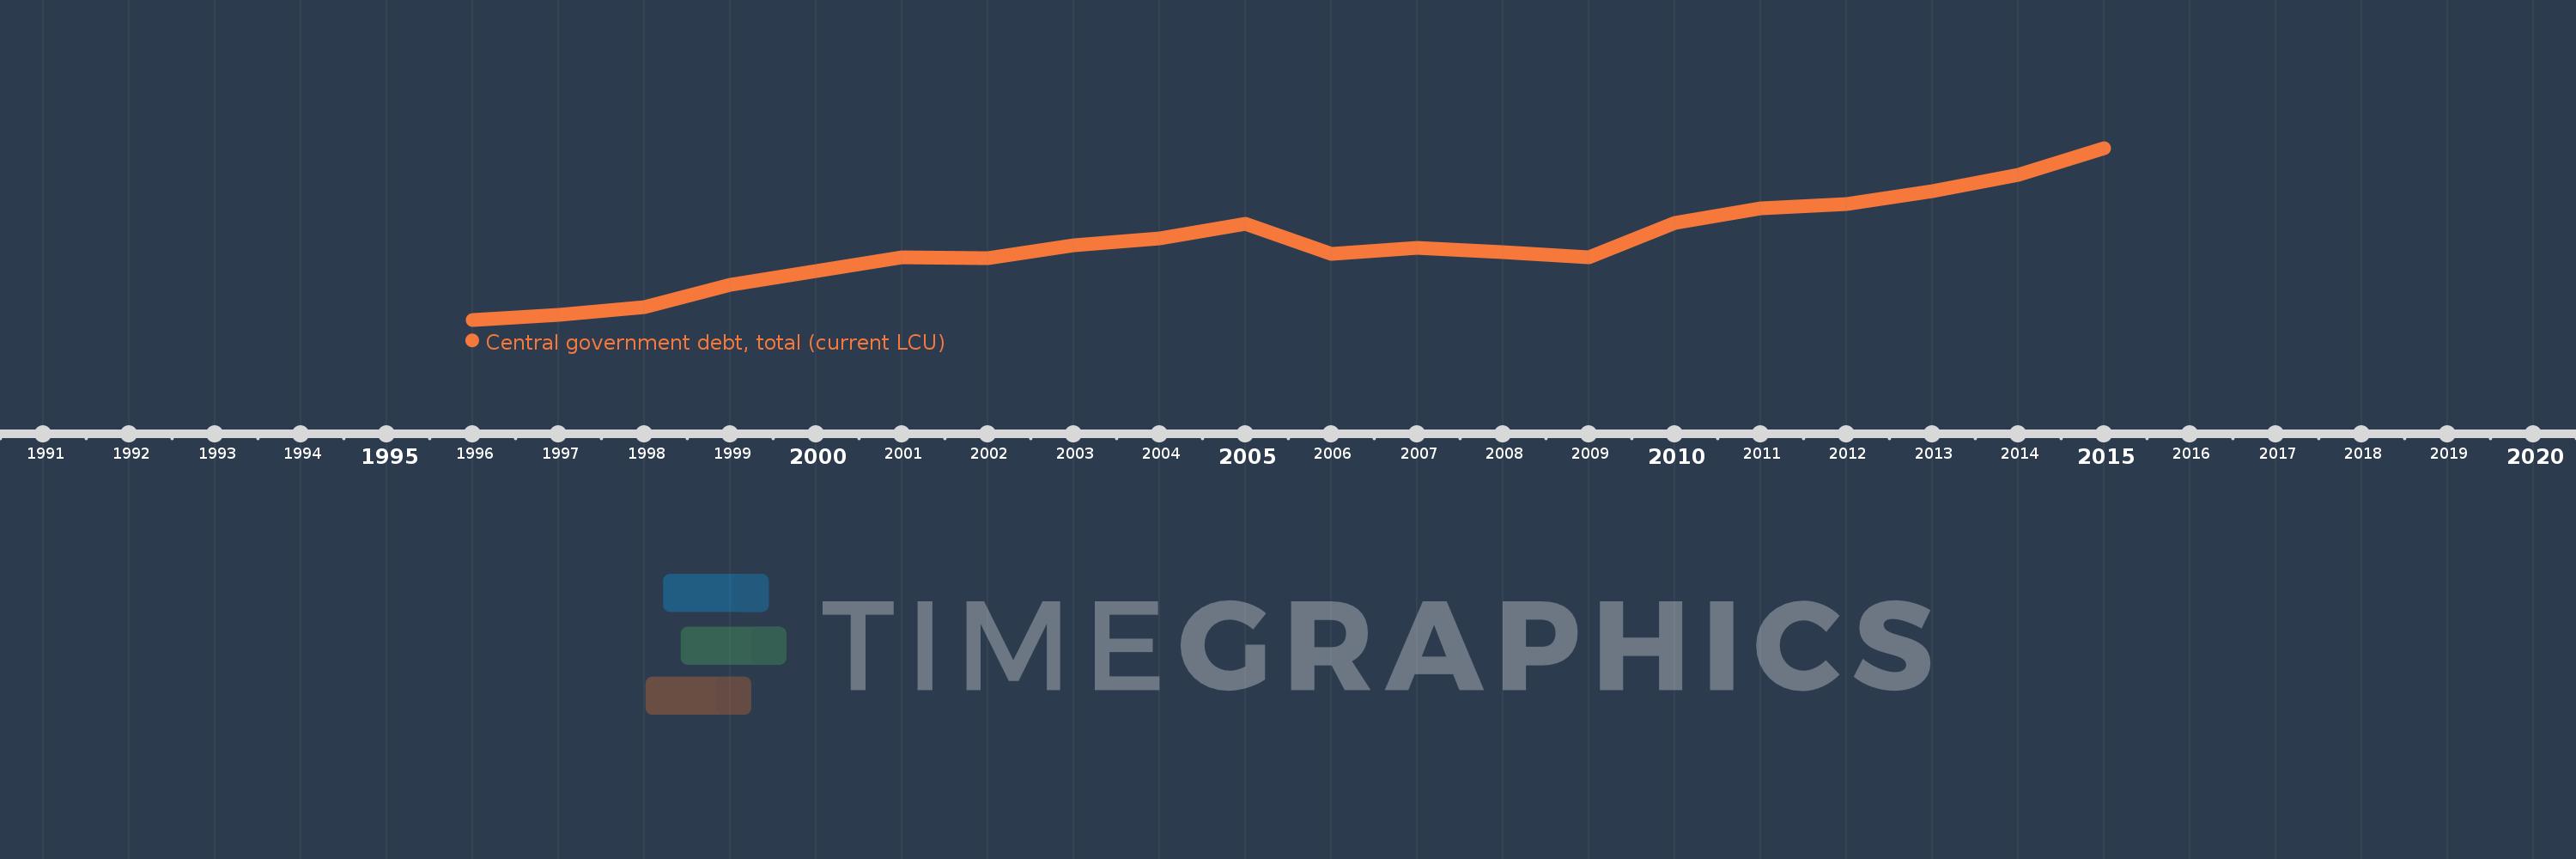
Central government debt, total (current LCU)
2015,2014,2013,2012,2011,2010,2009,2008,2007,2006,2005,2004,2003,2002,2001,2000,1999,1998,1997,1996
This statistics in other country:
Timeline:
This timeline shows a graph from 1996 to 2015 of Moldova. No data until 1995. Number of actual observations by date: 20.
Source name:
World Development Indicators
Source organization:
International Monetary Fund, Government Finance Statistics Yearbook and data files.
Categories, topics:
Public Sector
Last updated:
apr 23, 2017
Indicators value changes by year
Minimum:
2.438 bln
jan 1, 1996
Maximum:
27.8 bln
jan 1, 2015
At the date of observation
Value
Absolute change
Change from previous value
jan 1, 1996
2.438 bln
+2.438 bln
0.0%
jan 1, 1997
3.129 bln
+690.4 mln
28.32%
jan 1, 1998
4.288 bln
+1.159 bln
37.05%
jan 1, 1999
7.556 bln
+3.268 bln
76.22%
jan 1, 2000
9.598 bln
+2.042 bln
27.03%
jan 1, 2001
11.697 bln
+2.099 bln
21.87%
jan 1, 2002
11.579 bln
-118.8 mln
-1.02%
jan 1, 2003
13.434 bln
+1.856 bln
16.03%
jan 1, 2004
14.509 bln
+1.075 bln
8.0%
jan 1, 2005
16.642 bln
+2.133 bln
14.7%
jan 1, 2006
12.209 bln
-4.433 bln
-26.64%
jan 1, 2007
13.059 bln
+850.2 mln
6.96%
jan 1, 2008
12.417 bln
-642.0 mln
-4.92%
jan 1, 2009
11.604 bln
-812.5 mln
-6.54%
jan 1, 2010
16.698 bln
+5.094 bln
43.89%
jan 1, 2011
18.922 bln
+2.224 bln
13.32%
jan 1, 2012
19.524 bln
+601.7 mln
3.18%
jan 1, 2013
21.462 bln
+1.938 bln
9.93%
jan 1, 2014
23.808 bln
+2.346 bln
10.93%
jan 1, 2015
27.8 bln
+3.991 bln
16.76%
Ranking of countries by current statistics by years


Comments: