29
/
en
AIzaSyAYiBZKx7MnpbEhh9jyipgxe19OcubqV5w
April 1, 2024
118692
Denmark
DNK
true
2
1
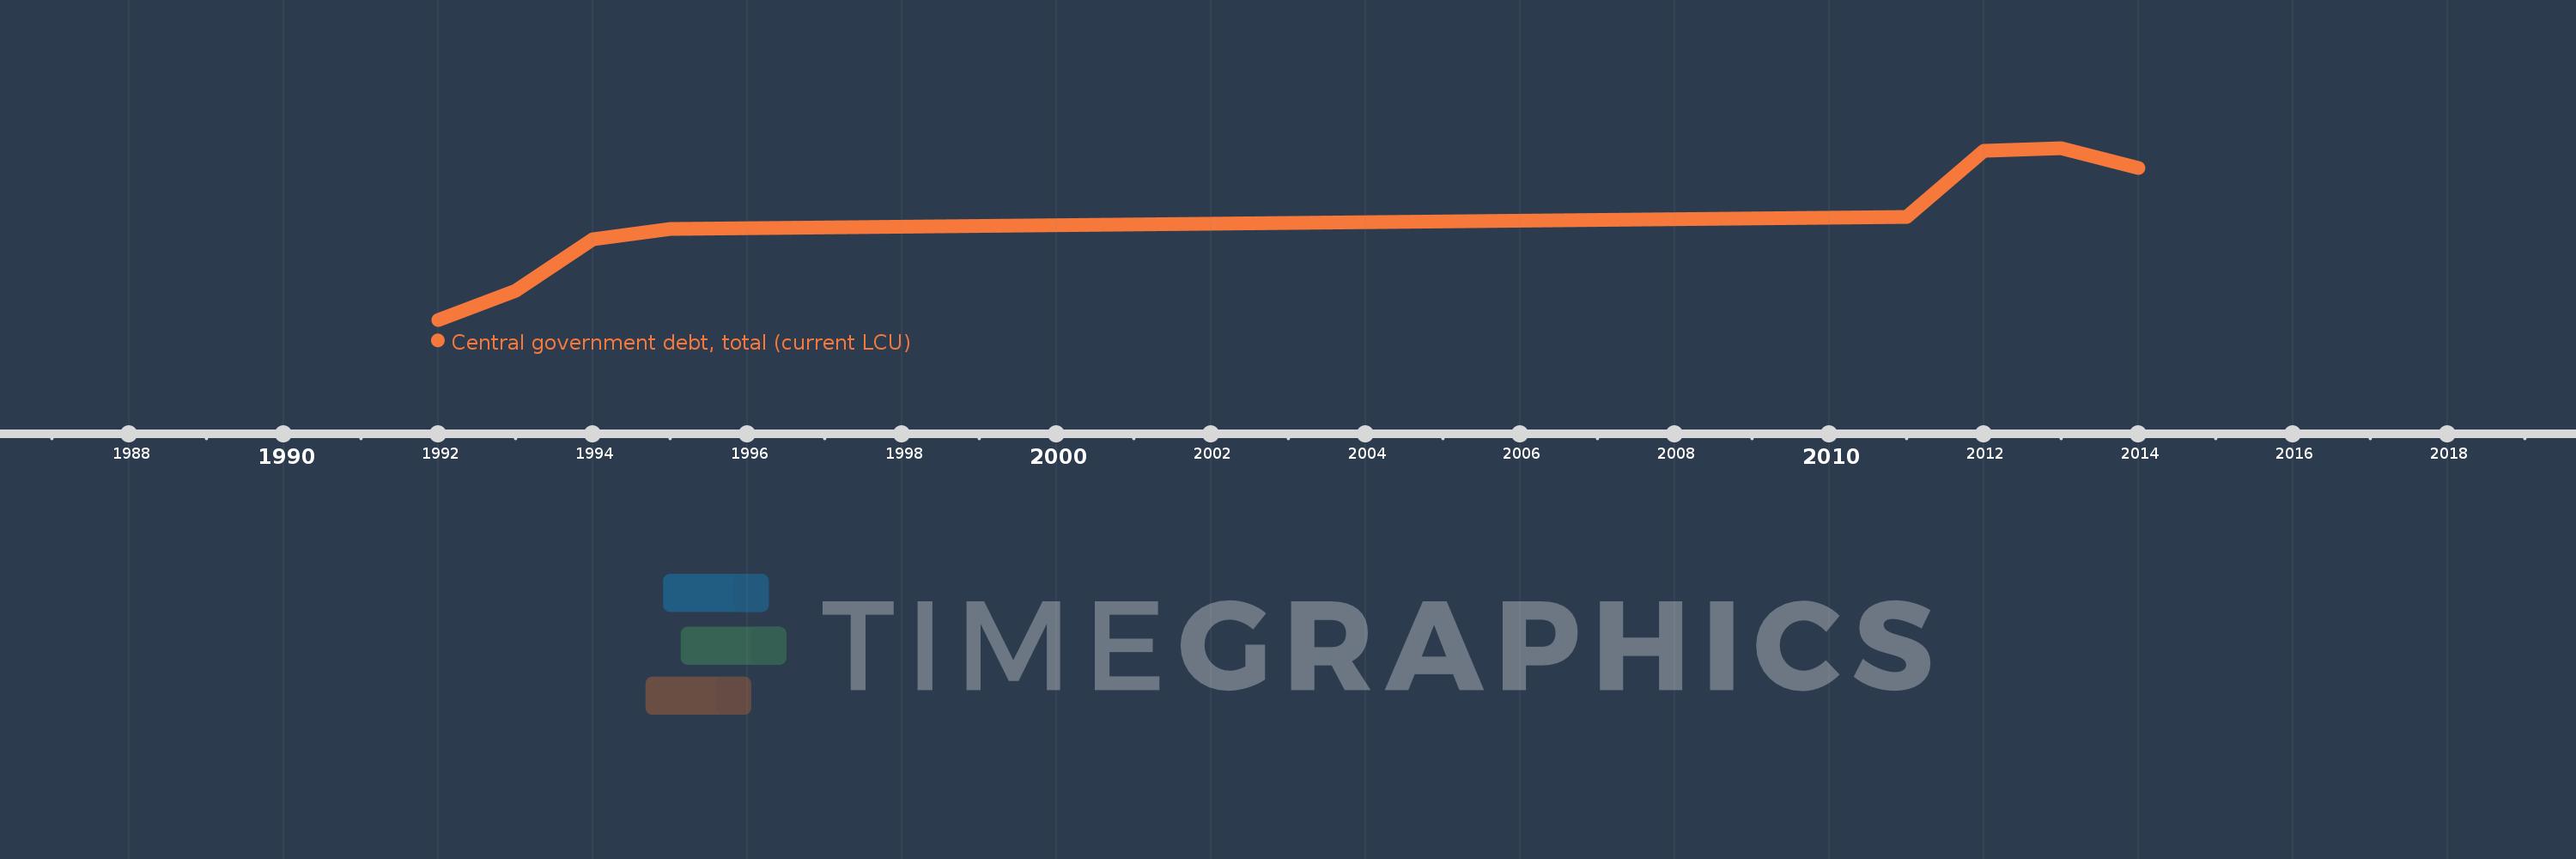
Central government debt, total (current LCU)
2014,2013,2012,2011,1995,1994,1993,1992
This statistics in other country:
Timeline:
This timeline shows a graph from 1992 to 2014 of Denmark. No data until 1991. Number of actual observations by date: 8.
Source name:
World Development Indicators
Source organization:
International Monetary Fund, Government Finance Statistics Yearbook and data files.
Categories, topics:
Public Sector
Last updated:
apr 23, 2017
Indicators value changes by year
Minimum:
553.347 bln
jan 1, 1992
Maximum:
921.65 bln
jan 1, 2013
At the date of observation
Value
Absolute change
Change from previous value
jan 1, 1992
553.347 bln
+553.347 bln
0.0%
jan 1, 1993
614.981 bln
+61.634 bln
11.14%
jan 1, 1994
726.424 bln
+111.443 bln
18.12%
jan 1, 1995
747.563 bln
+21.139 bln
2.91%
jan 1, 2011
773.986 bln
+26.423 bln
3.53%
jan 1, 2012
915.147 bln
+141.161 bln
18.24%
jan 1, 2013
921.65 bln
+6.503 bln
0.71%
jan 1, 2014
878.468 bln
-43.182 bln
-4.69%
Ranking of countries by current statistics by years


Comments: