29
/
en
AIzaSyAYiBZKx7MnpbEhh9jyipgxe19OcubqV5w
April 1, 2024
79761
Barbados
BRB
true
2
1
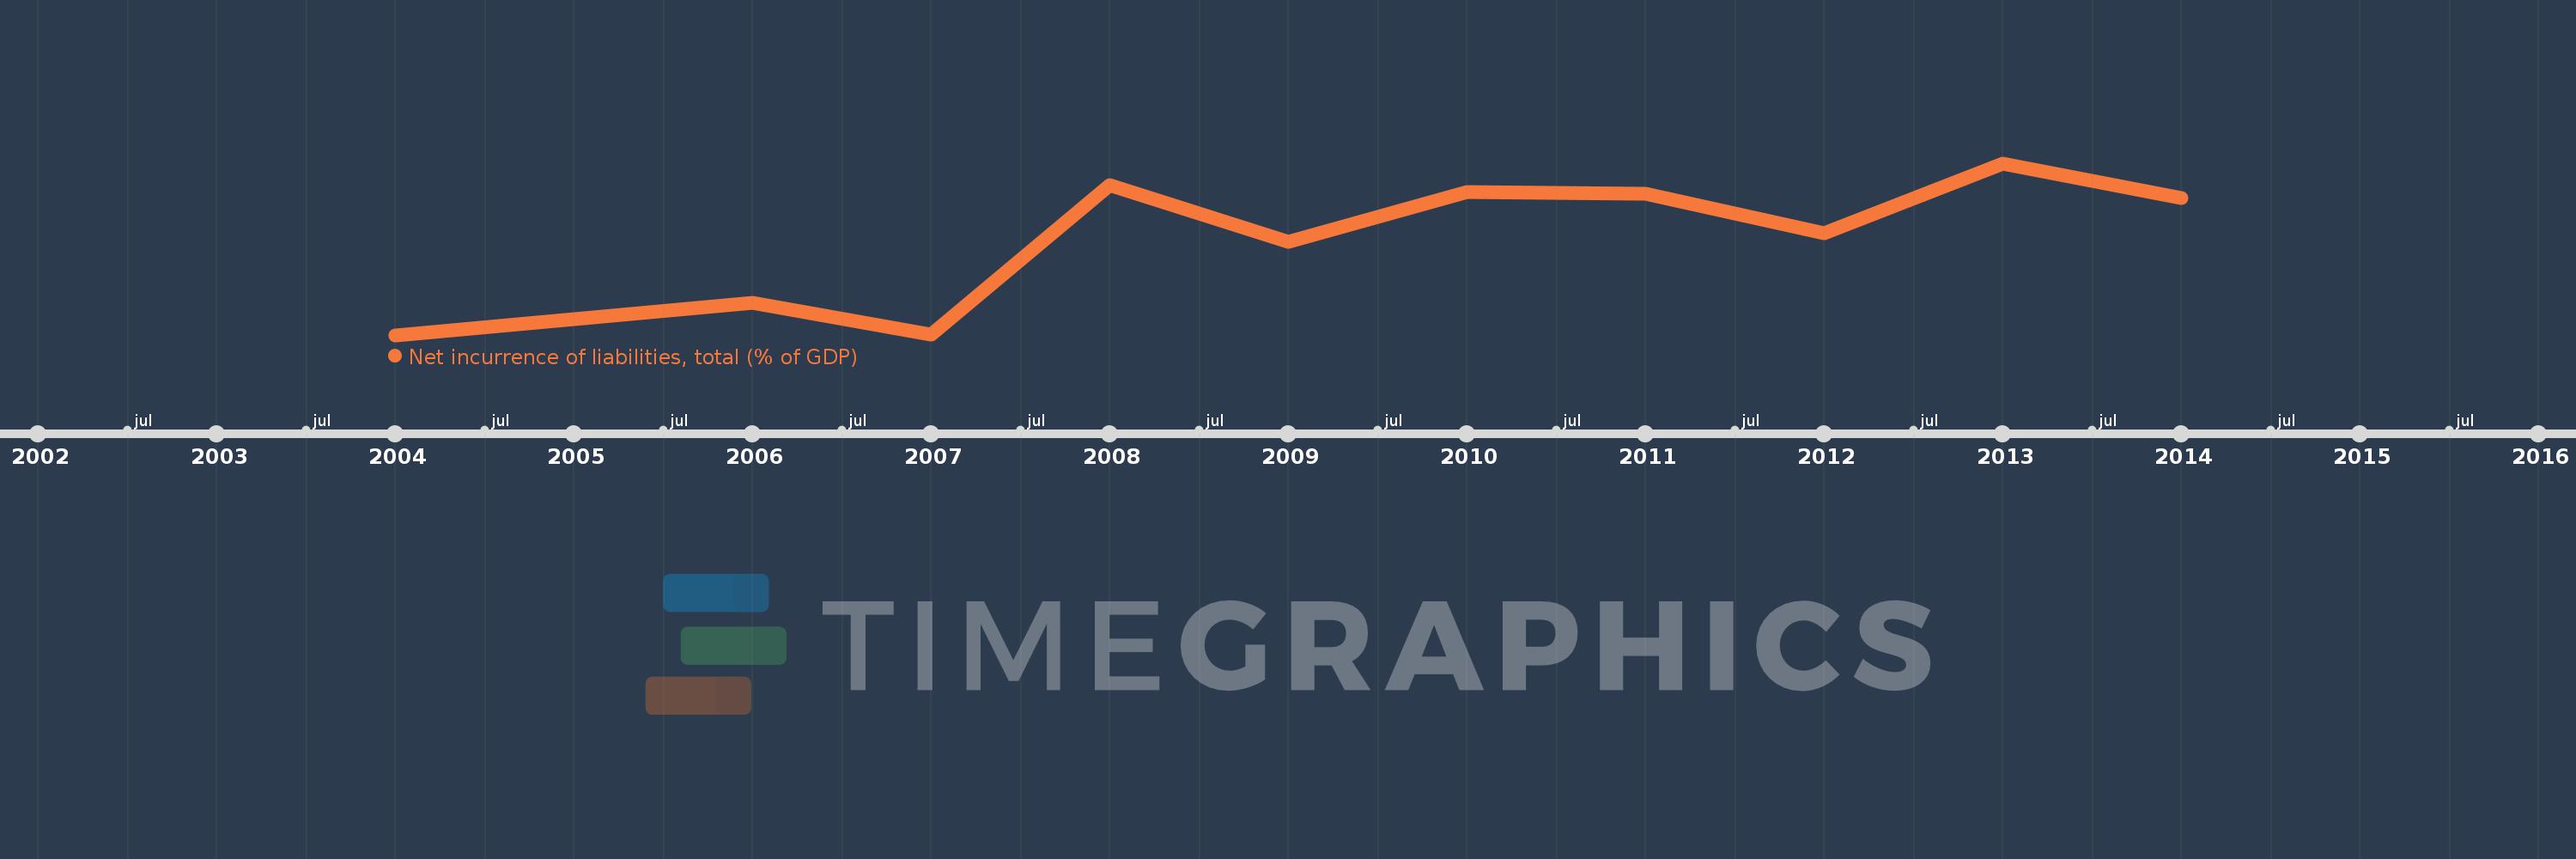
Net incurrence of liabilities, total (% of GDP)
2014,2013,2012,2011,2010,2009,2008,2007,2006,2004
This statistics in other country:
Timeline:
This timeline shows a graph from 2004 to 2014 of Barbados. No data until 2003. Number of actual observations by date: 10.
Source name:
World Development Indicators
Source organization:
International Monetary Fund, Government Finance Statistics Yearbook and data files.
Categories, topics:
Public Sector
Last updated:
apr 23, 2017
Indicators value changes by year
Maximum:
12.288
jan 1, 2013
At the date of observation
Value
Absolute change
Change from previous value
jan 1, 2004
1.021
+1.021
0.0%
jan 1, 2006
3.124
+2.104
206.12%
jan 1, 2007
1.053
-2.072
-66.31%
jan 1, 2008
10.848
+9.796
930.64%
jan 1, 2009
7.125
-3.724
-34.33%
jan 1, 2010
10.378
+3.254
45.67%
jan 1, 2011
10.316
-0.062
-0.6%
jan 1, 2012
7.707
-2.609
-25.29%
jan 1, 2013
12.288
+4.581
59.44%
jan 1, 2014
10.021
-2.267
-18.45%
Ranking of countries by current statistics by years


Comments: