29
/
en
AIzaSyAYiBZKx7MnpbEhh9jyipgxe19OcubqV5w
April 1, 2024
256642
Sweden
SWE
true
2
1
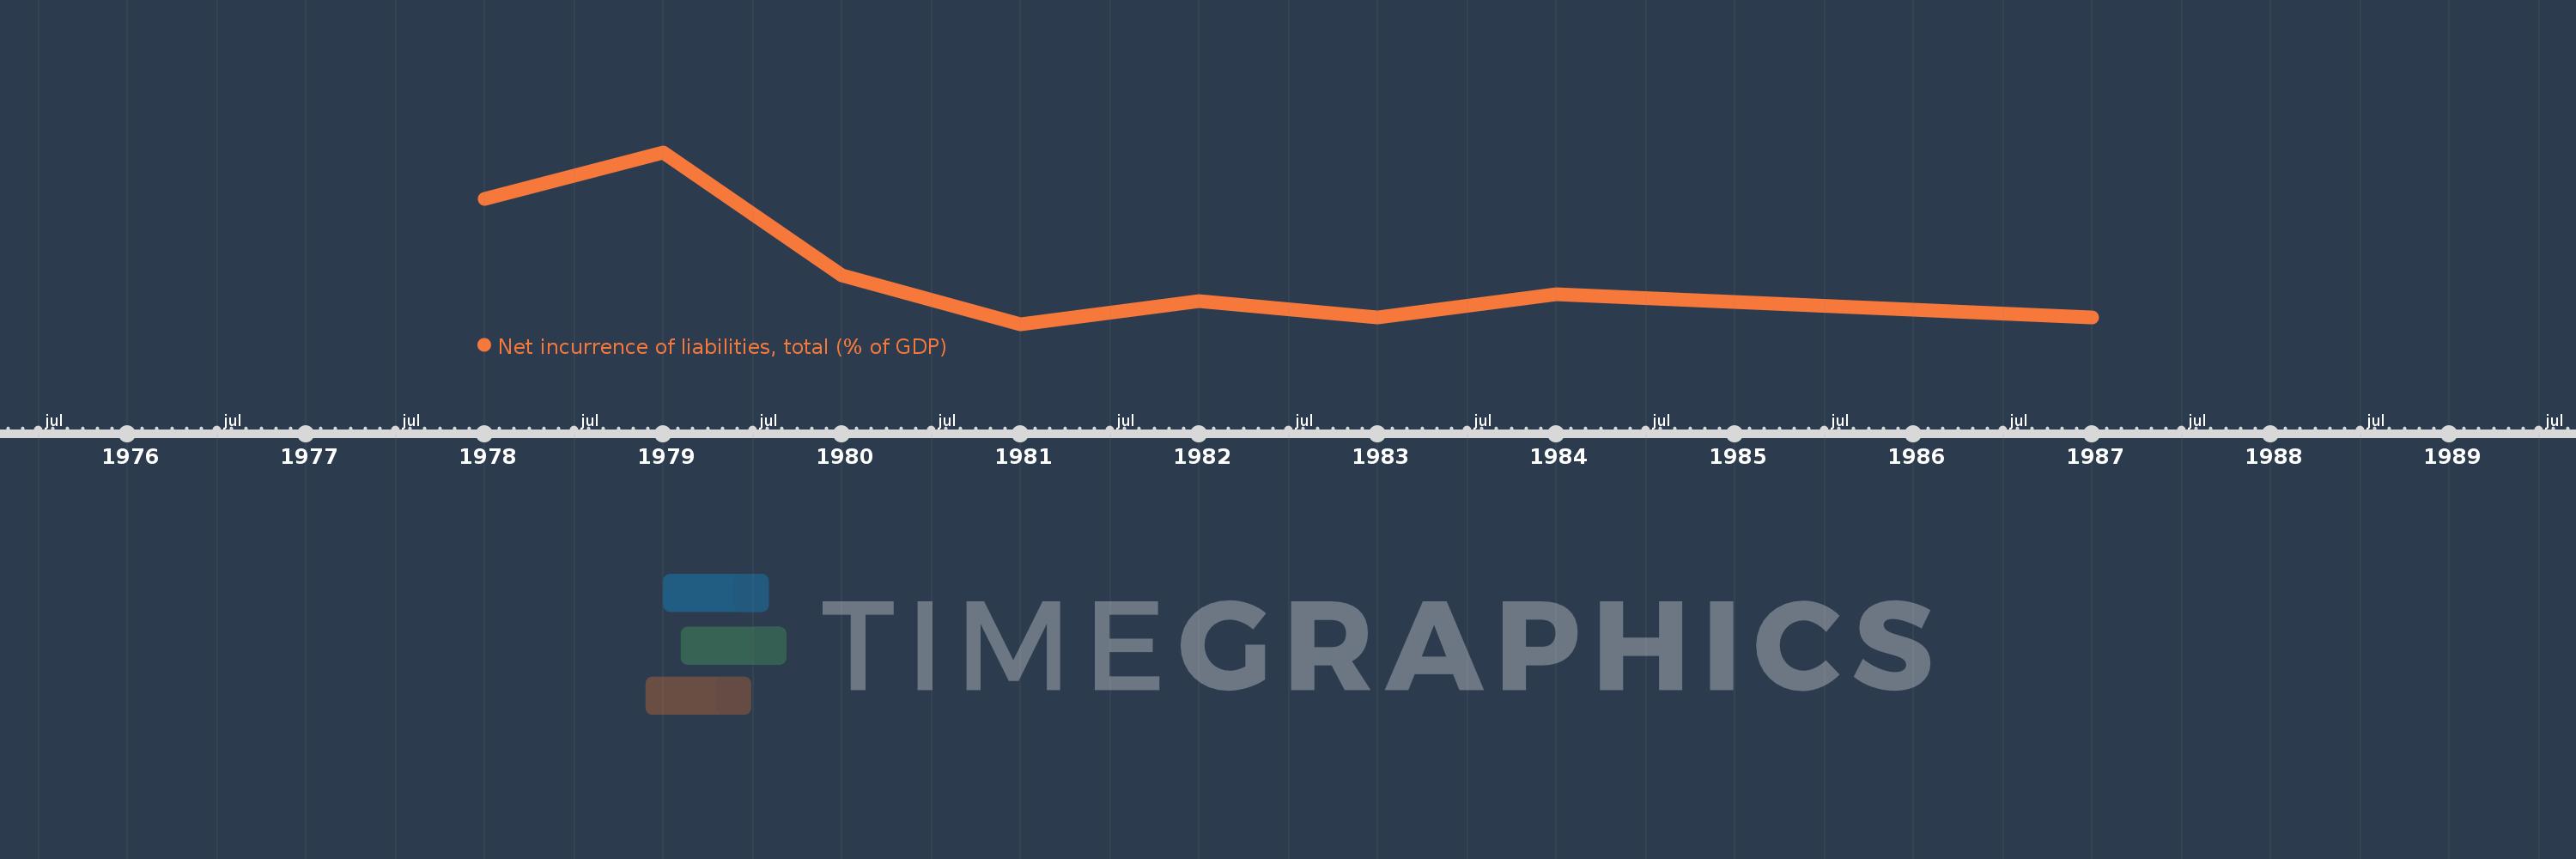
Net incurrence of liabilities, total (% of GDP)
1987,1984,1983,1982,1981,1980,1979,1978
This statistics in other country:
Timeline:
This timeline shows a graph from 1978 to 1987 of Sweden. No data until 1977. Number of actual observations by date: 8.
Source name:
World Development Indicators
Source organization:
International Monetary Fund, Government Finance Statistics Yearbook and data files.
Categories, topics:
Public Sector
Last updated:
apr 23, 2017
Indicators value changes by year
Maximum:
13.357
jan 1, 1979
At the date of observation
Value
Absolute change
Change from previous value
jan 1, 1978
9.892
+9.892
0.0%
jan 1, 1979
13.357
+3.465
35.03%
jan 1, 1980
4.254
-9.103
-68.15%
jan 1, 1981
0.624
-3.63
-85.34%
jan 1, 1982
2.347
+1.723
276.27%
jan 1, 1983
1.118
-1.229
-52.35%
jan 1, 1984
2.87
+1.751
156.59%
jan 1, 1987
1.107
-1.763
-61.42%
Ranking of countries by current statistics by years


Comments: