29
/
en
AIzaSyAYiBZKx7MnpbEhh9jyipgxe19OcubqV5w
April 1, 2024
264975
Togo
TGO
true
2
1
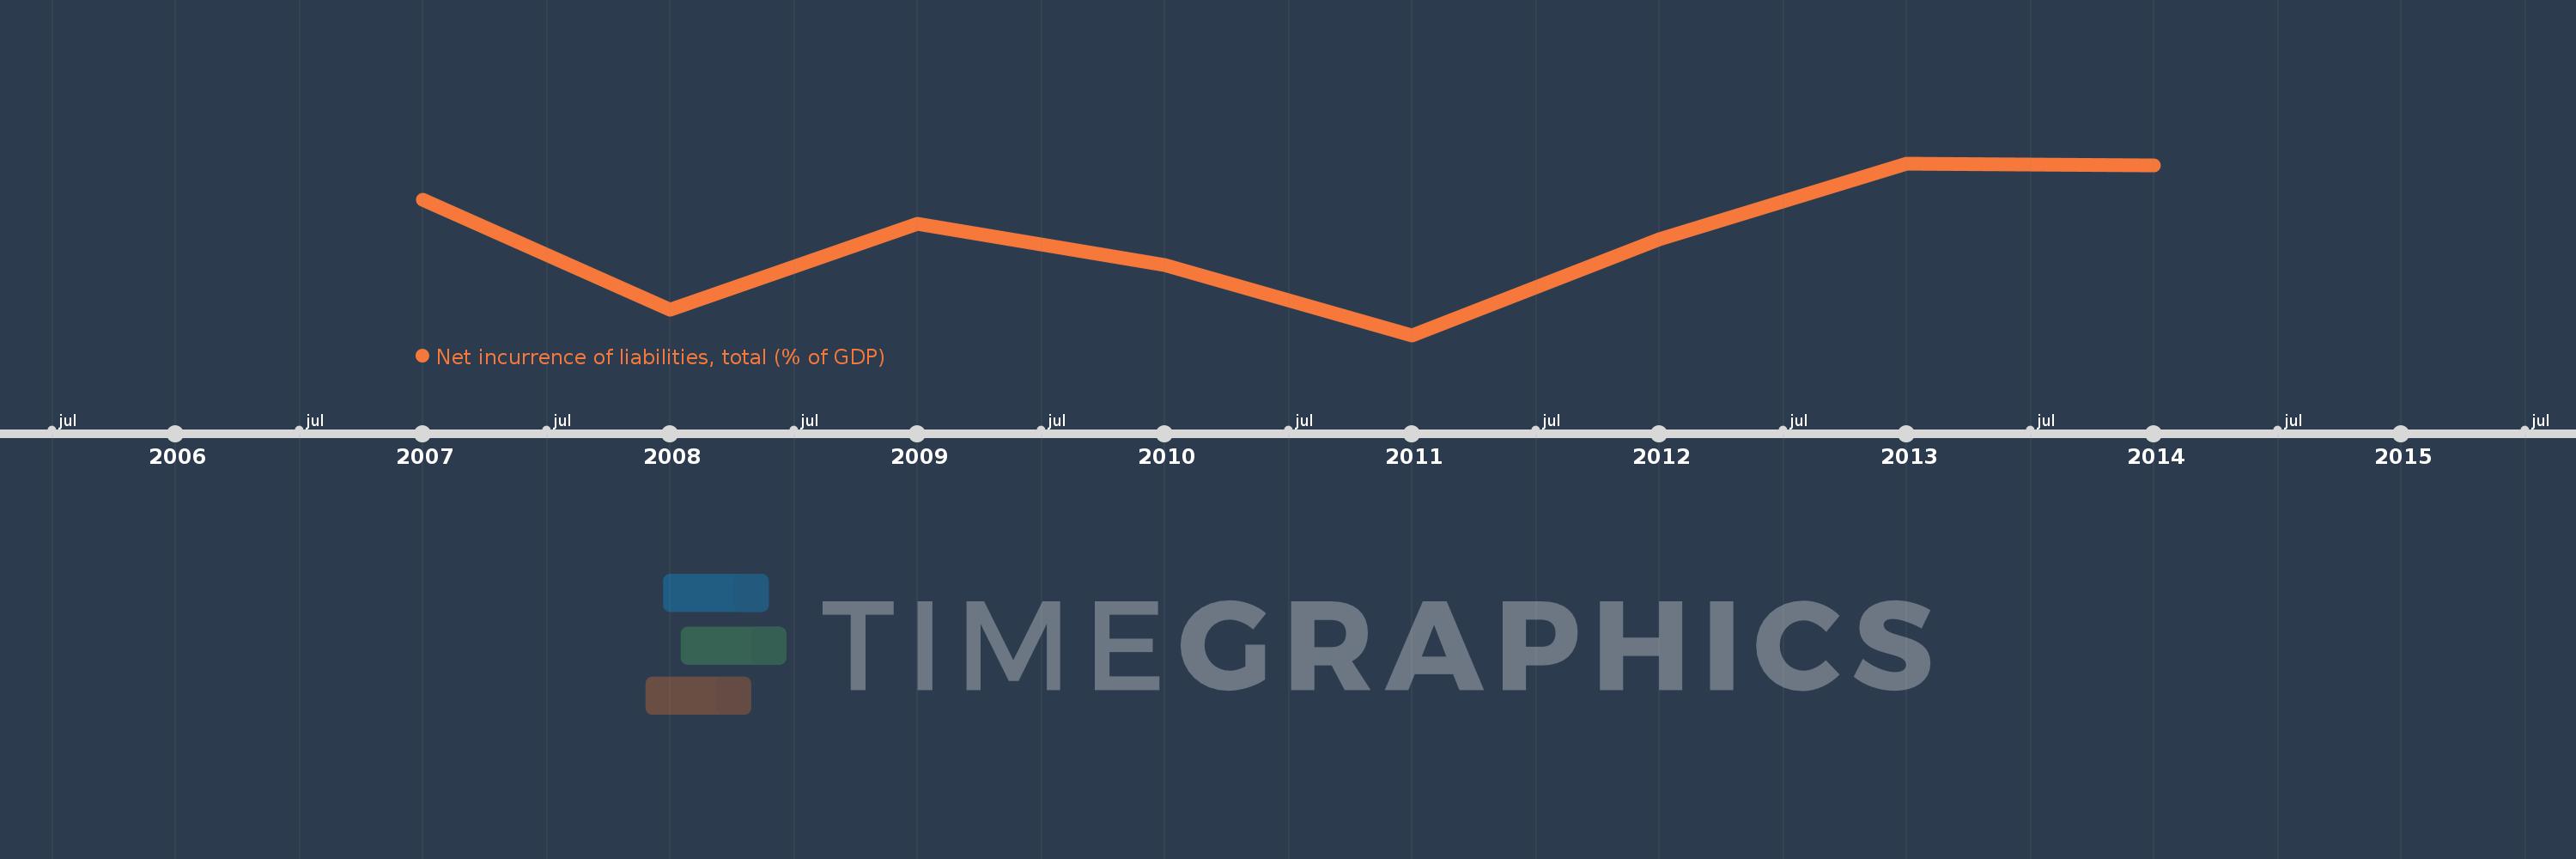
Net incurrence of liabilities, total (% of GDP)
2014,2013,2012,2011,2010,2009,2008,2007
This statistics in other country:
Timeline:
This timeline shows a graph from 2007 to 2014 of Togo. No data until 2006. Number of actual observations by date: 8.
Source name:
World Development Indicators
Source organization:
International Monetary Fund, Government Finance Statistics Yearbook and data files.
Categories, topics:
Public Sector
Last updated:
apr 23, 2017
Indicators value changes by year
Minimum:
-0.773
jan 1, 2011
At the date of observation
Value
Absolute change
Change from previous value
jan 1, 2007
4.659
+4.659
0.0%
jan 1, 2008
0.253
-4.407
-94.58%
jan 1, 2009
3.678
+3.425
1.36K%
jan 1, 2010
2.036
-1.642
-44.64%
jan 1, 2011
-0.773
-2.809
-137.99%
jan 1, 2012
3.074
+3.848
-497.51%
jan 1, 2013
6.125
+3.05
99.21%
jan 1, 2014
6.041
-0.084
-1.37%
Ranking of countries by current statistics by years


Comments: