29
/
en
AIzaSyAYiBZKx7MnpbEhh9jyipgxe19OcubqV5w
April 1, 2024
255511
Swaziland
SWZ
true
2
1
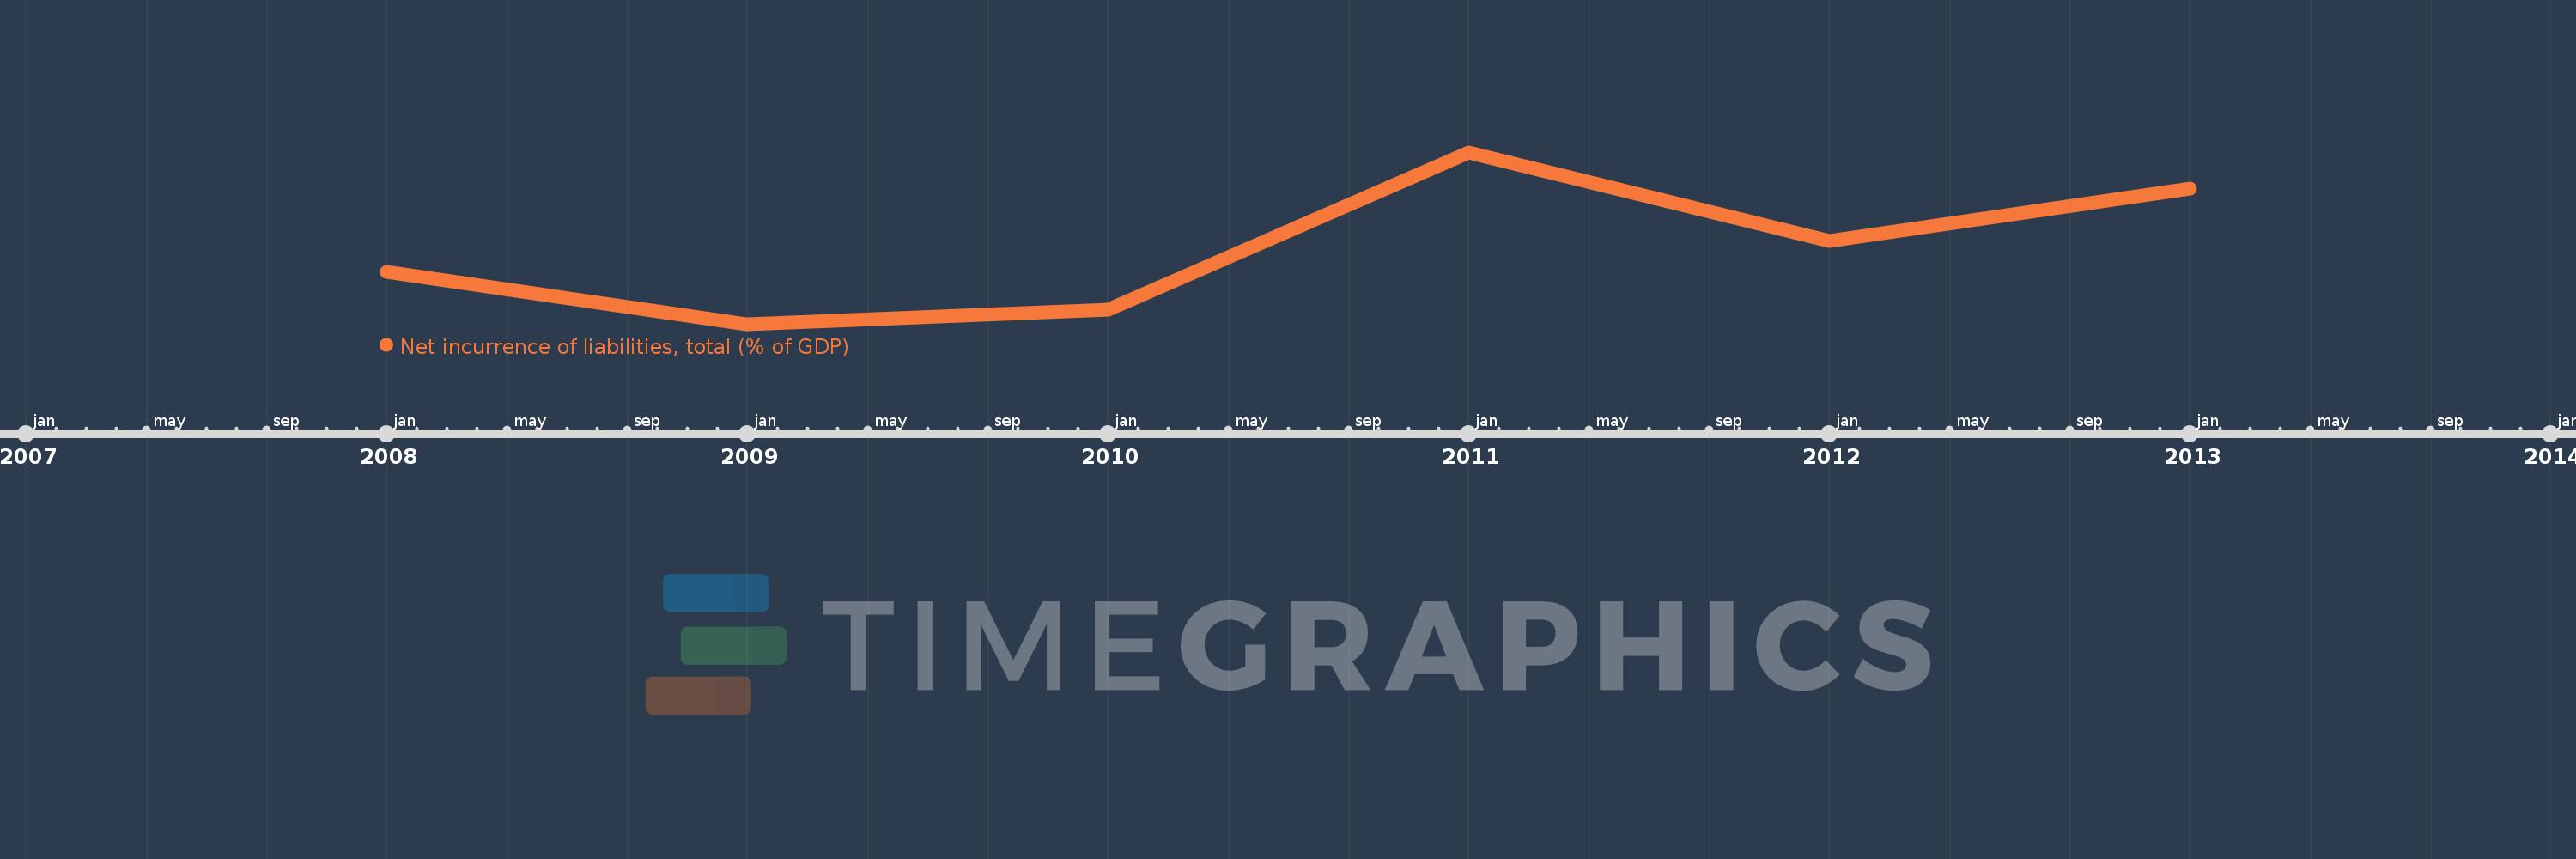
Net incurrence of liabilities, total (% of GDP)
2013,2012,2011,2010,2009,2008
This statistics in other country:
Timeline:
This timeline shows a graph from 2008 to 2013 of Swaziland. No data until 2007. Number of actual observations by date: 6.
Source name:
World Development Indicators
Source organization:
International Monetary Fund, Government Finance Statistics Yearbook and data files.
Categories, topics:
Public Sector
Last updated:
apr 23, 2017
Indicators value changes by year
At the date of observation
Value
Absolute change
Change from previous value
jan 1, 2008
0.207
+0.207
0.0%
jan 1, 2009
-0.96
-1.167
-562.52%
jan 1, 2010
-0.645
+0.315
-32.82%
jan 1, 2011
2.858
+3.502
-543.28%
jan 1, 2012
0.899
-1.958
-68.53%
jan 1, 2013
2.053
+1.154
128.3%
Ranking of countries by current statistics by years


Comments: