29
/
en
AIzaSyAYiBZKx7MnpbEhh9jyipgxe19OcubqV5w
April 1, 2024
129682
Estonia
EST
true
2
1
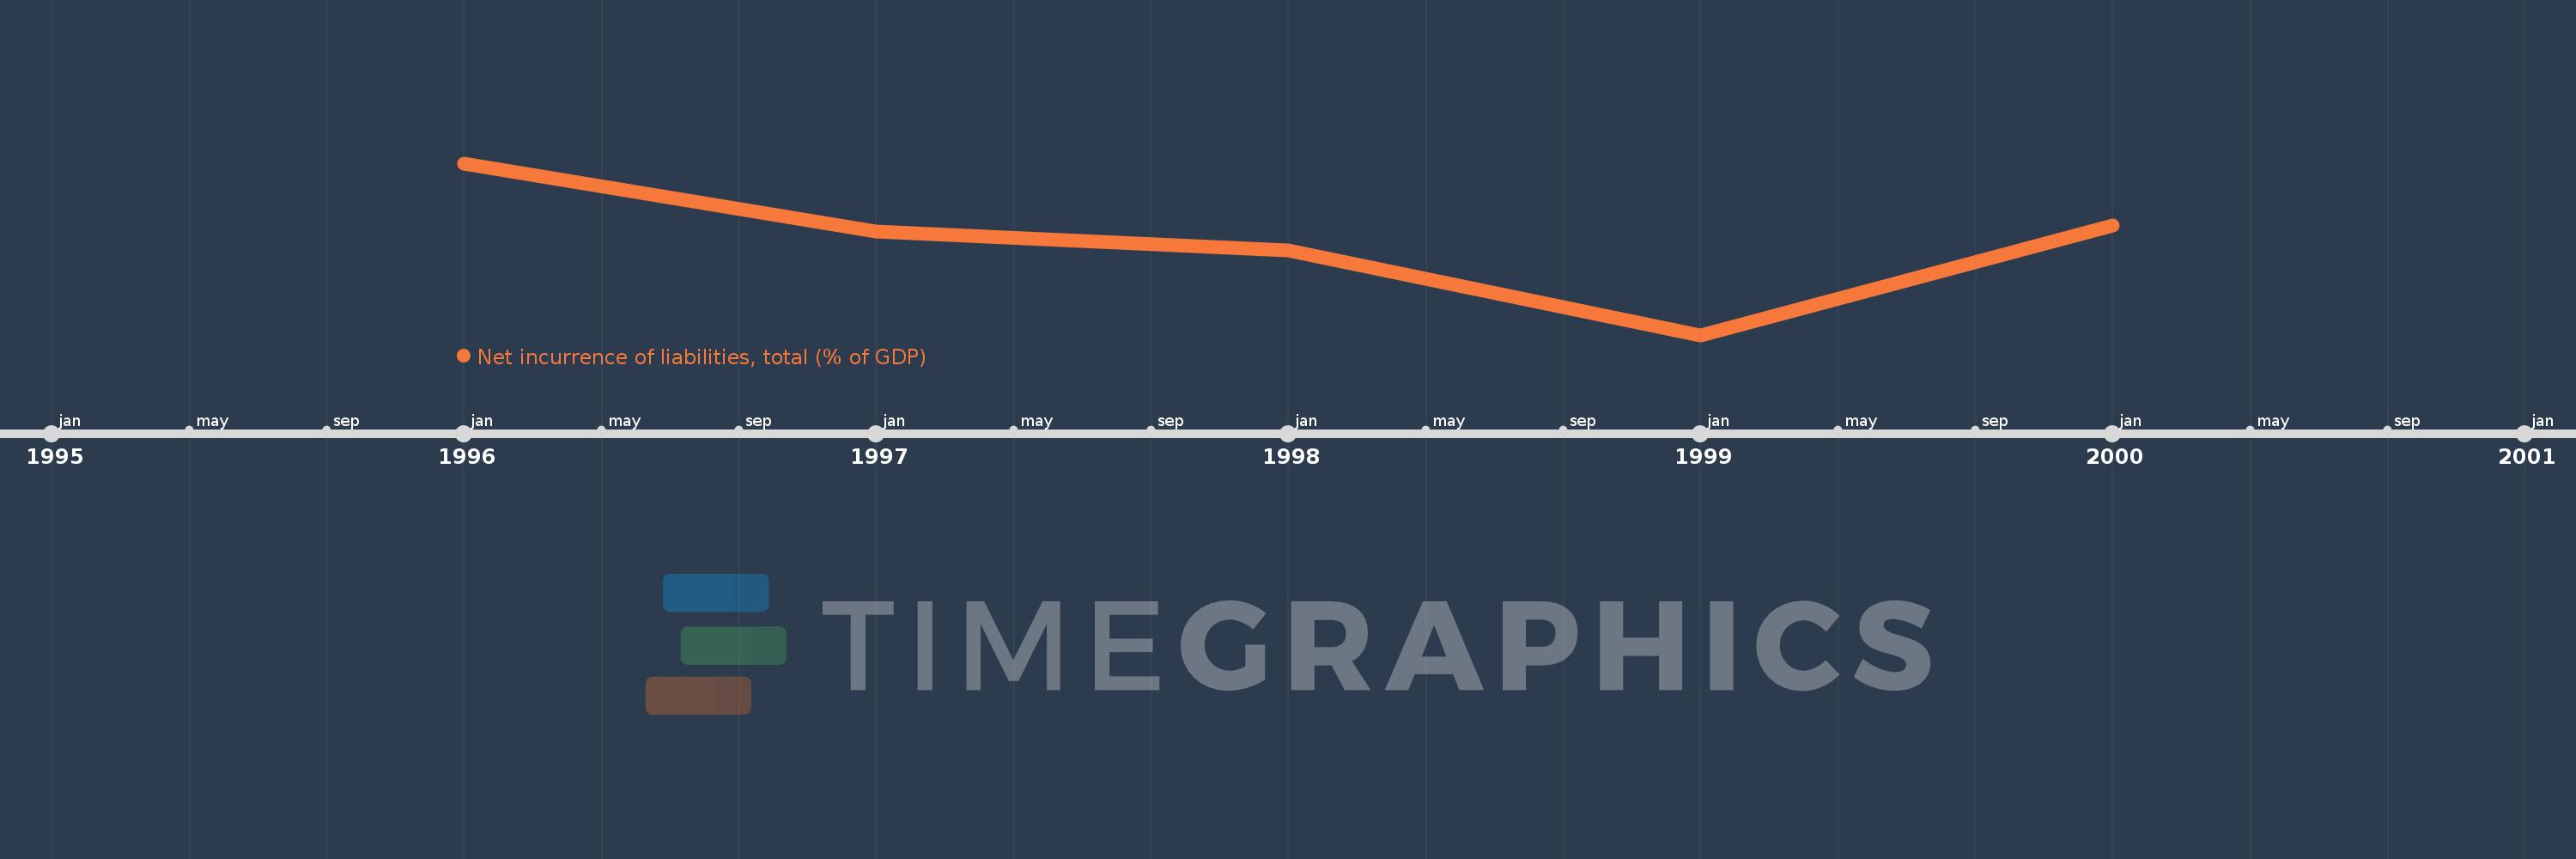
Net incurrence of liabilities, total (% of GDP)
2000,1999,1998,1997,1996
This statistics in other country:
Timeline:
This timeline shows a graph from 1996 to 2000 of Estonia. No data until 1995. Number of actual observations by date: 5.
Source name:
World Development Indicators
Source organization:
International Monetary Fund, Government Finance Statistics Yearbook and data files.
Categories, topics:
Public Sector
Last updated:
apr 23, 2017
Indicators value changes by year
Minimum:
-0.022
jan 1, 1999
At the date of observation
Value
Absolute change
Change from previous value
jan 1, 1996
0.14
+0.14
0.0%
jan 1, 1997
0.076
-0.064
-45.67%
jan 1, 1998
0.058
-0.018
-23.12%
jan 1, 1999
-0.022
-0.08
-136.91%
jan 1, 2000
0.081
+0.103
-477.71%
Ranking of countries by current statistics by years


Comments: