29
/
en
AIzaSyAYiBZKx7MnpbEhh9jyipgxe19OcubqV5w
April 1, 2024
262645
Thailand
THA
true
2
1
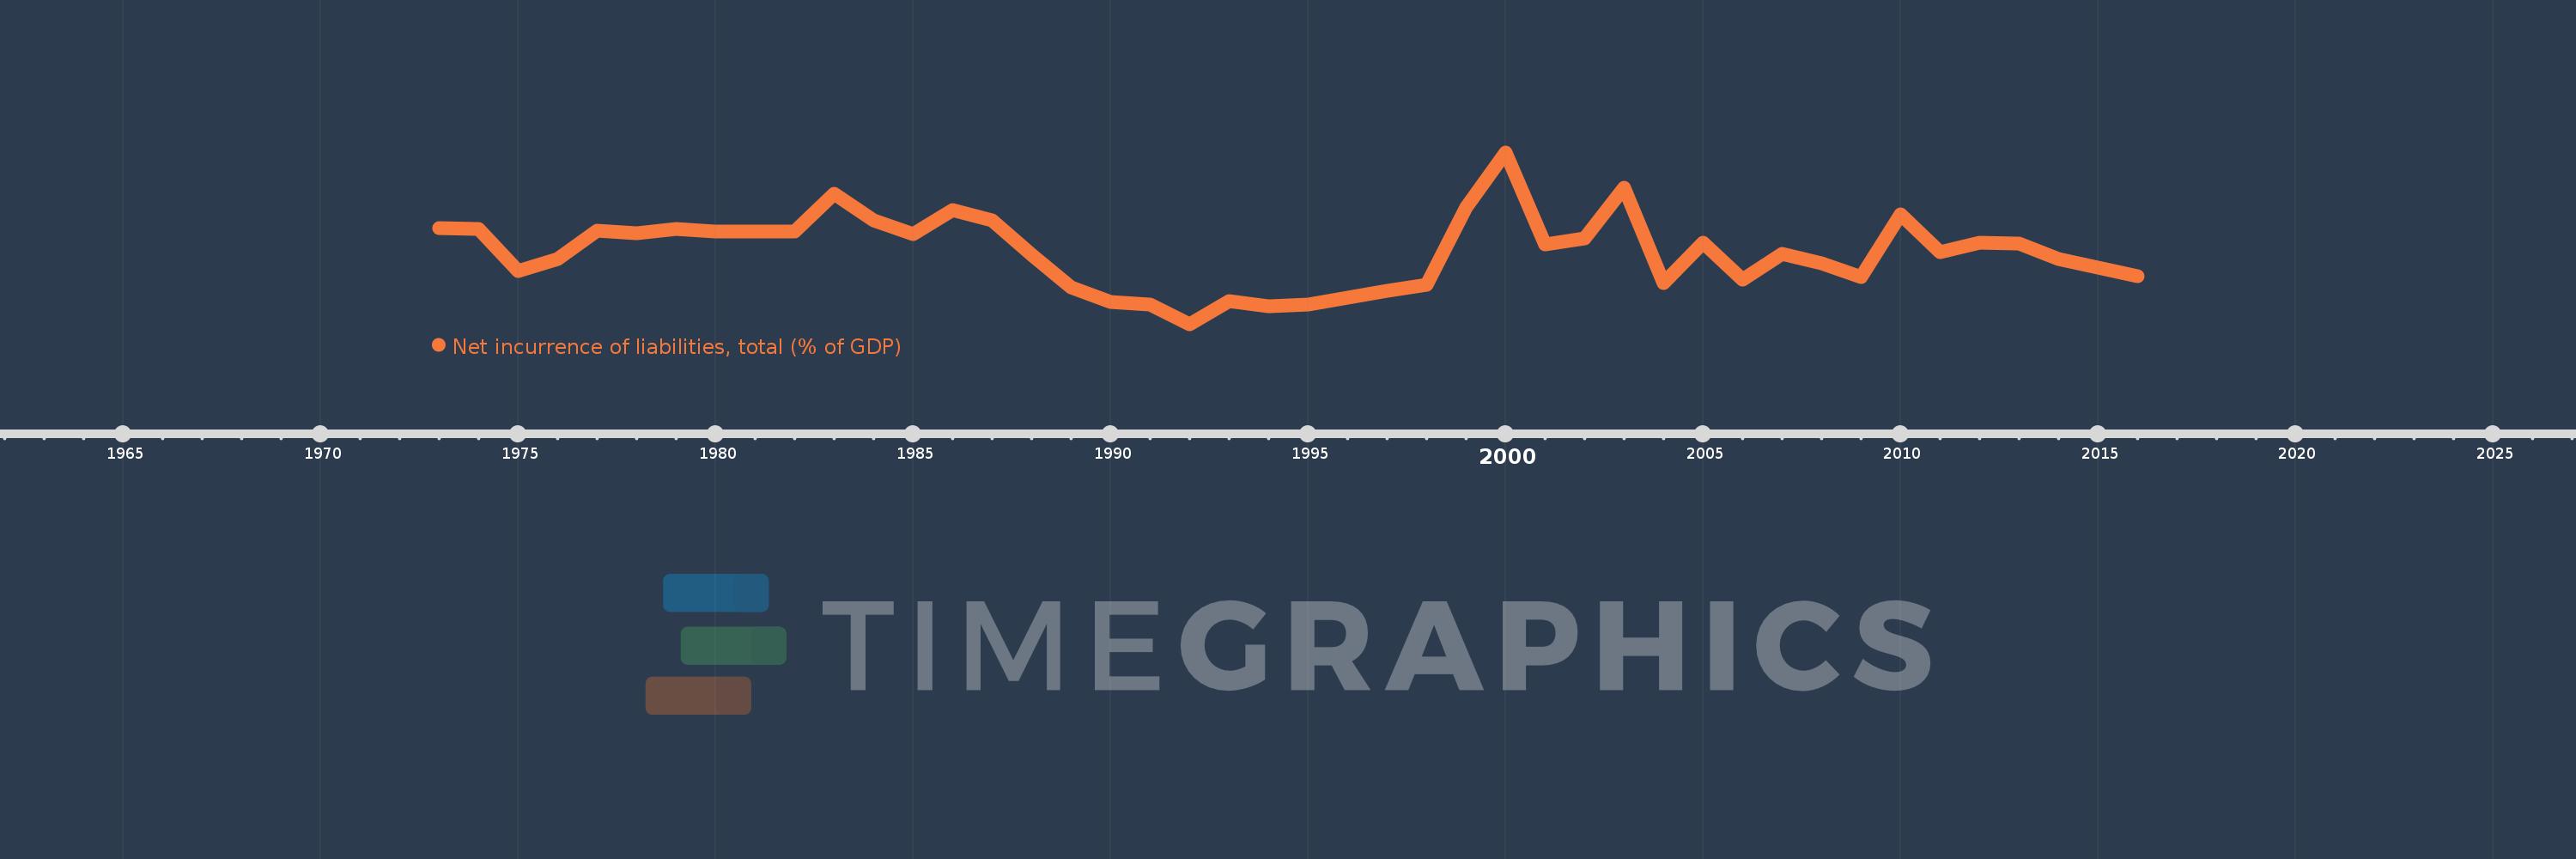
Net incurrence of liabilities, total (% of GDP)
2016,2015,2014,2013,2012,2011,2010,2009,2008,2007,2006,2005,2004,2003,2002,2001,2000,1999,1998,1997,1996,1995,1994,1993,1992,1991,1990,1989,1988,1987,1986,1985,1984,1983,1982,1981,1980,1979,1978,1977,1976,1975,1974,1973
This statistics in other country:
Timeline:
This timeline shows a graph from 1973 to 2016 of Thailand. No data until 1972. Number of actual observations by date: 44.
Source name:
World Development Indicators
Source organization:
International Monetary Fund, Government Finance Statistics Yearbook and data files.
Categories, topics:
Public Sector
Last updated:
apr 23, 2017
Indicators value changes by year
Minimum:
-2.557
jan 1, 1992
At the date of observation
Value
Absolute change
Change from previous value
jan 1, 1973
3.982
+3.982
0.0%
jan 1, 1974
3.895
-0.087
-2.18%
jan 1, 1975
1.076
-2.819
-72.37%
jan 1, 1976
1.895
+0.819
76.11%
jan 1, 1977
3.806
+1.91
100.78%
jan 1, 1978
3.62
-0.186
-4.89%
jan 1, 1979
3.888
+0.269
7.42%
jan 1, 1980
3.708
-0.18
-4.64%
jan 1, 1981
3.722
+0.014
0.38%
jan 1, 1982
3.753
+0.03
0.82%
jan 1, 1983
6.301
+2.549
67.92%
jan 1, 1984
4.468
-1.834
-29.1%
jan 1, 1985
3.56
-0.908
-20.32%
jan 1, 1986
5.2
+1.64
46.08%
jan 1, 1987
4.491
-0.709
-13.64%
jan 1, 1988
2.169
-2.322
-51.71%
jan 1, 1989
-0.057
-2.226
-102.64%
jan 1, 1990
-1.046
-0.989
1.73K%
jan 1, 1991
-1.215
-0.169
16.13%
jan 1, 1992
-2.557
-1.343
110.52%
jan 1, 1993
-0.978
+1.579
-61.74%
jan 1, 1994
-1.351
-0.372
38.07%
jan 1, 1995
-1.225
+0.126
-9.32%
jan 1, 1996
-0.742
+0.483
-39.43%
jan 1, 1997
-0.26
+0.482
-64.96%
jan 1, 1998
0.099
+0.359
-138.02%
jan 1, 1999
5.396
+5.298
5.36K%
jan 1, 2000
9.106
+3.709
68.74%
jan 1, 2001
2.877
-6.229
-68.41%
jan 1, 2002
3.247
+0.37
12.86%
jan 1, 2003
6.721
+3.474
107.02%
jan 1, 2004
0.265
-6.456
-96.05%
jan 1, 2005
2.966
+2.7
1.02K%
jan 1, 2006
0.465
-2.501
-84.31%
jan 1, 2007
2.215
+1.75
376.03%
jan 1, 2008
1.572
-0.643
-29.01%
jan 1, 2009
0.633
-0.939
-59.73%
jan 1, 2010
4.909
+4.275
675.17%
jan 1, 2011
2.334
-2.574
-52.45%
jan 1, 2012
2.998
+0.664
28.43%
jan 1, 2013
2.937
-0.061
-2.03%
jan 1, 2014
1.884
-1.053
-35.85%
jan 1, 2015
1.279
-0.605
-32.12%
jan 1, 2016
0.683
-0.596
-46.63%
Ranking of countries by current statistics by years


Comments: