29
/
en
AIzaSyAYiBZKx7MnpbEhh9jyipgxe19OcubqV5w
April 1, 2024
177995
Lesotho
LSO
true
2
1
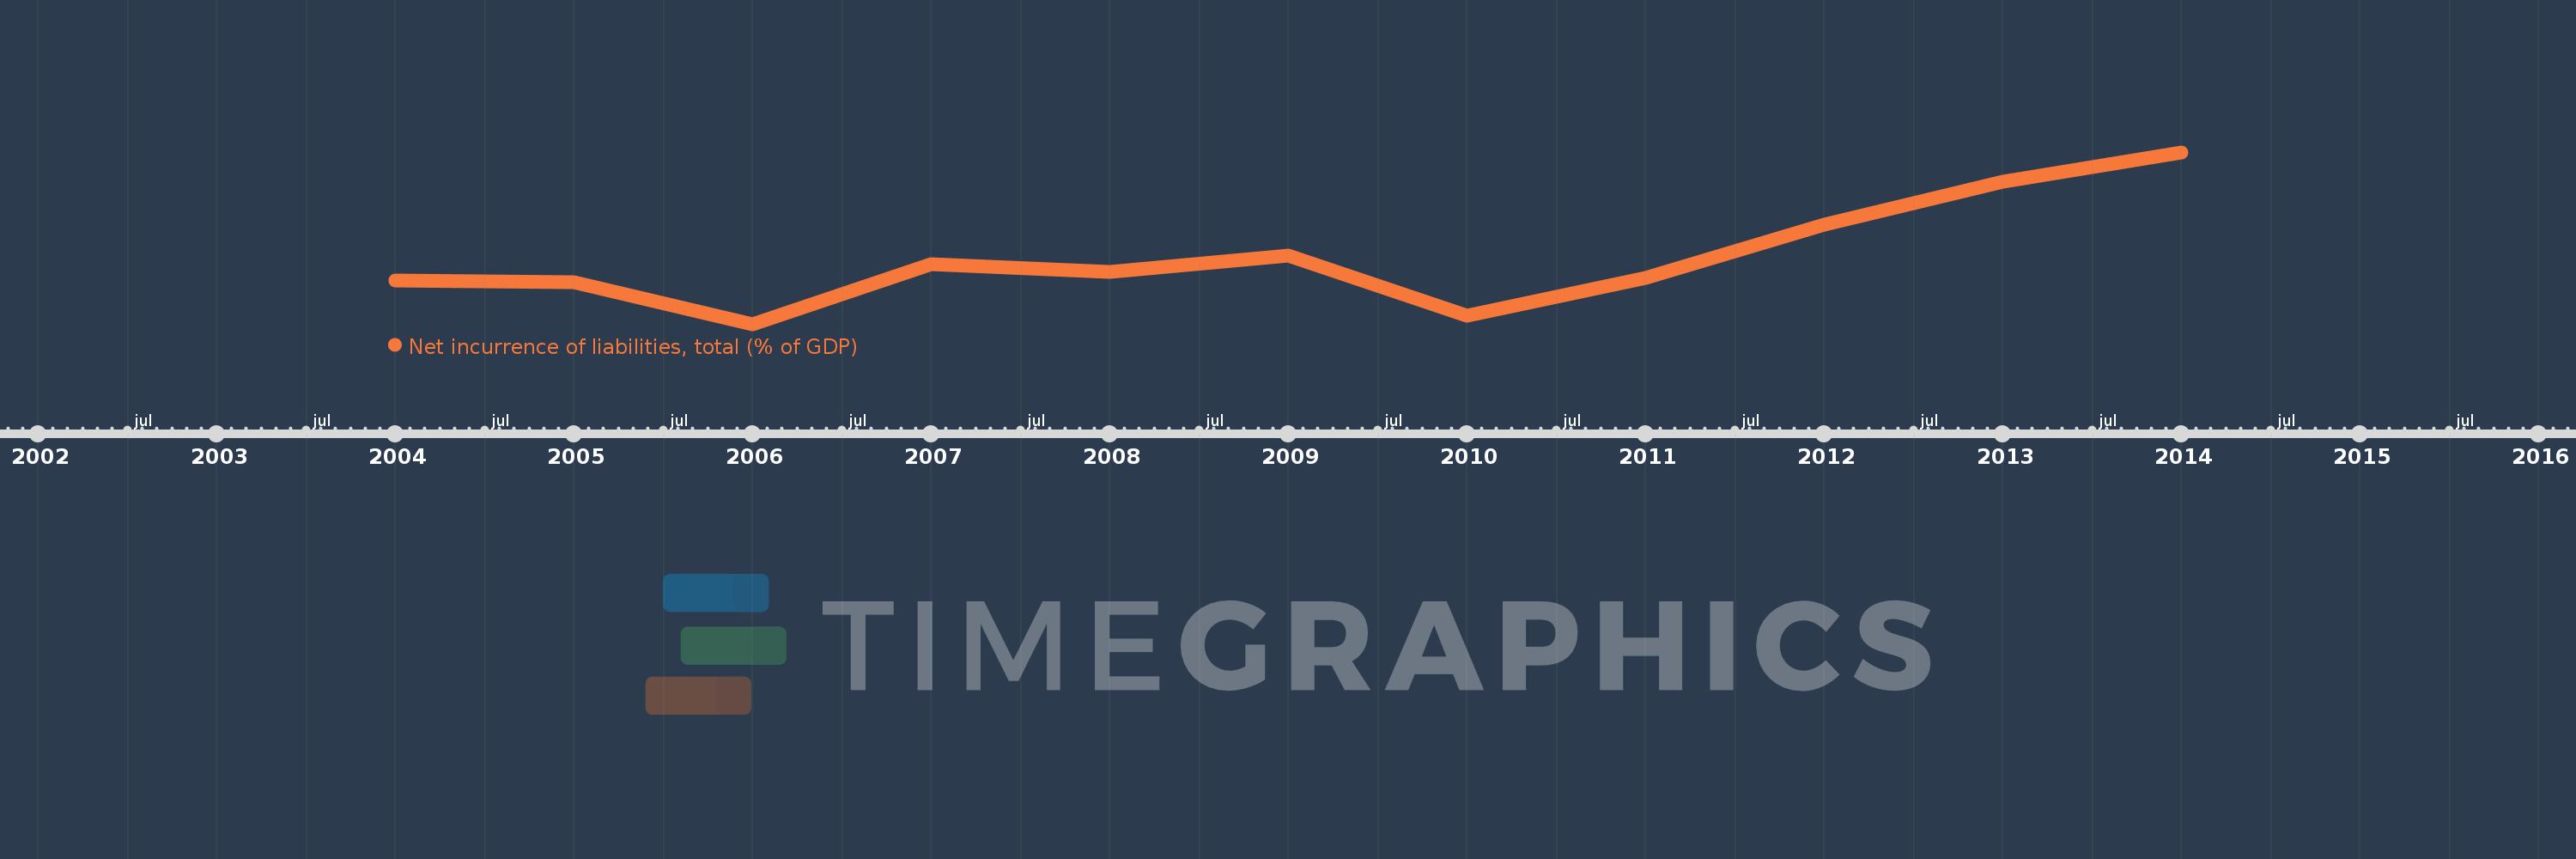
Net incurrence of liabilities, total (% of GDP)
2014,2013,2012,2011,2010,2009,2008,2007,2006,2005,2004
This statistics in other country:
Timeline:
This timeline shows a graph from 2004 to 2014 of Lesotho. No data until 2003. Number of actual observations by date: 11.
Source name:
World Development Indicators
Source organization:
International Monetary Fund, Government Finance Statistics Yearbook and data files.
Categories, topics:
Public Sector
Last updated:
apr 23, 2017
Indicators value changes by year
Minimum:
-2.585
jan 1, 2006
At the date of observation
Value
Absolute change
Change from previous value
jan 1, 2004
-0.293
-0.293
0.0%
jan 1, 2005
-0.392
-0.099
33.71%
jan 1, 2006
-2.585
-2.193
559.0%
jan 1, 2007
0.526
+3.111
-120.34%
jan 1, 2008
0.133
-0.393
-74.72%
jan 1, 2009
0.977
+0.844
634.75%
jan 1, 2010
-2.155
-3.132
-320.54%
jan 1, 2011
-0.173
+1.982
-91.99%
jan 1, 2012
2.611
+2.783
-1.61K%
jan 1, 2013
4.854
+2.243
85.93%
jan 1, 2014
6.373
+1.519
31.29%
Ranking of countries by current statistics by years


Comments: