29
/
en
AIzaSyAYiBZKx7MnpbEhh9jyipgxe19OcubqV5w
April 1, 2024
25973
Central Europe and the Baltics
CEB
false
2
1
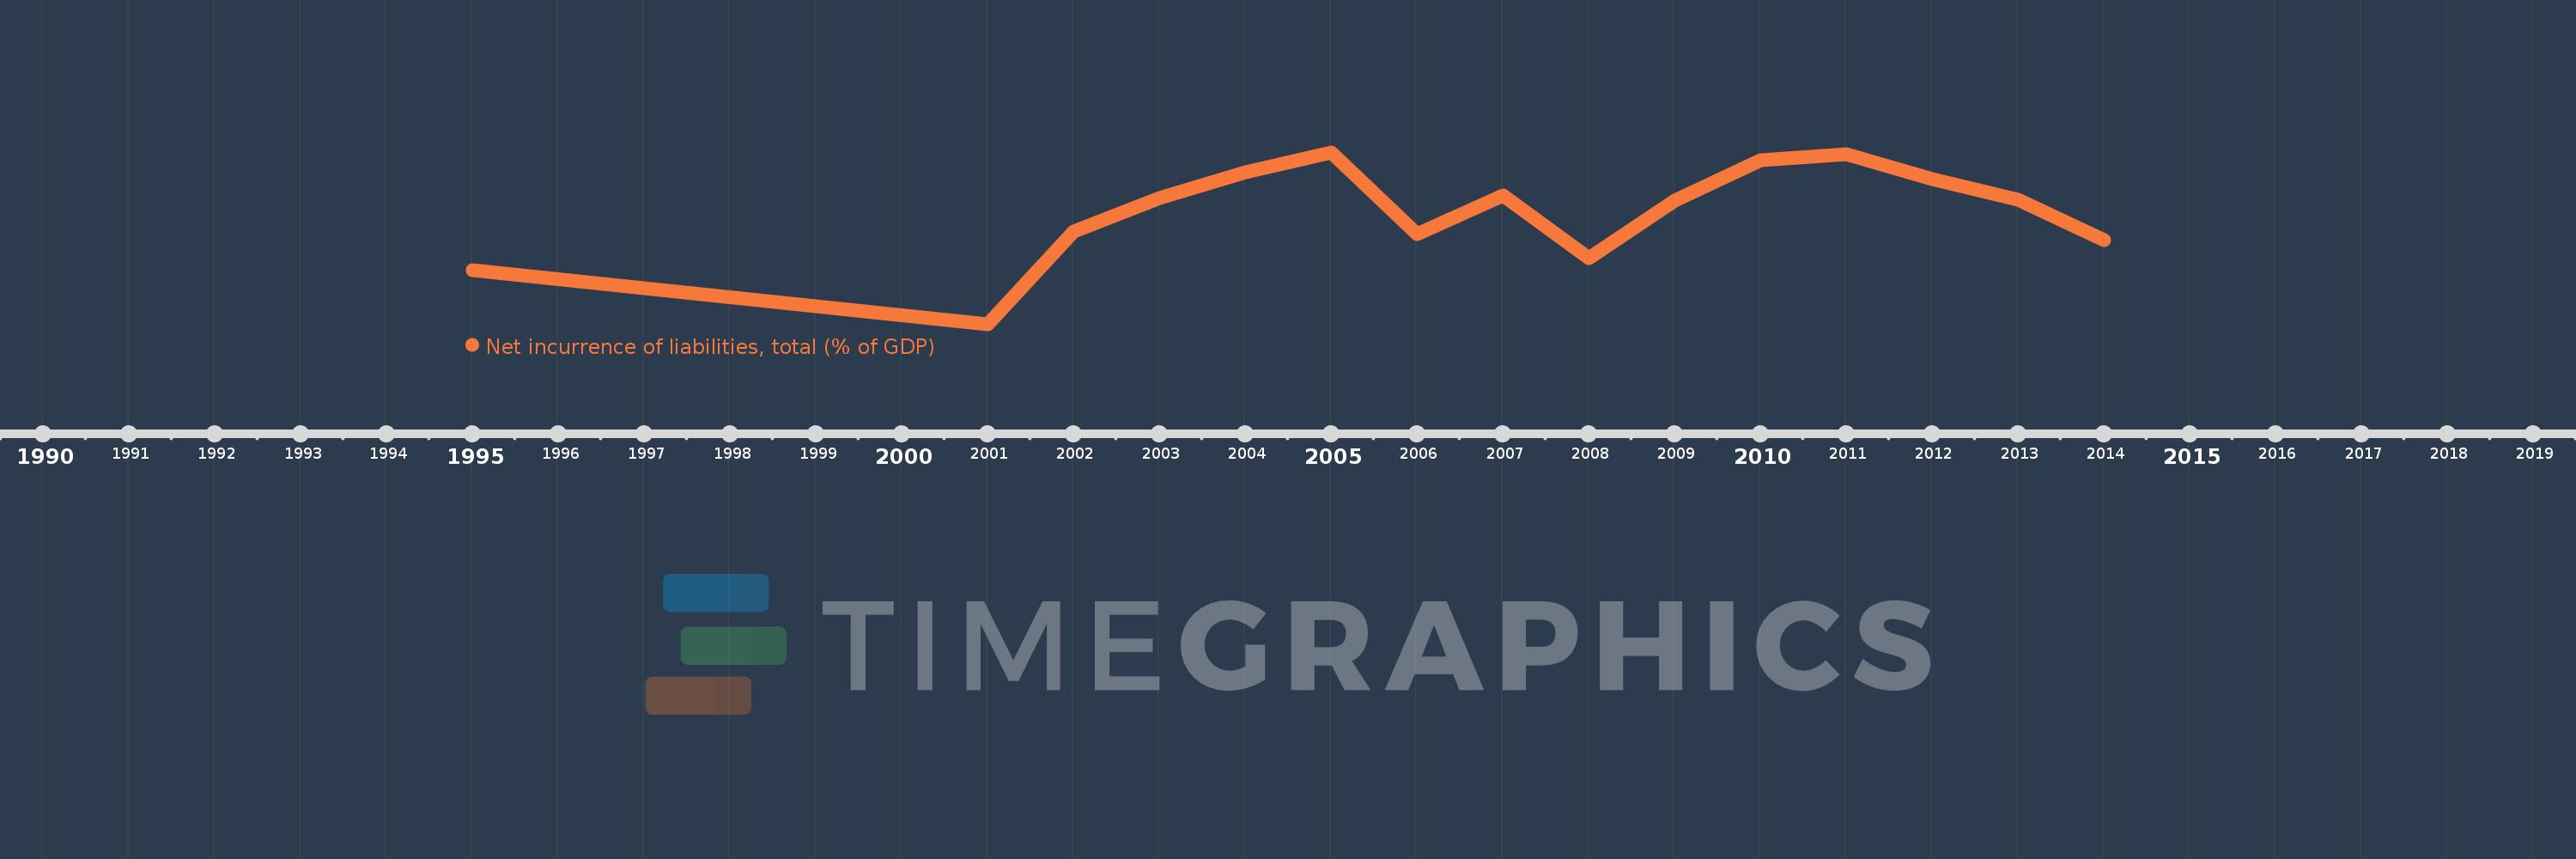
Net incurrence of liabilities, total (% of GDP)
2014,2013,2012,2011,2010,2009,2008,2007,2006,2005,2004,2003,2002,2001,1995
This statistics in other country:
Timeline:
This timeline shows a graph from 1995 to 2014 of Central Europe and the Baltics. No data until 1994. Number of actual observations by date: 15.
Source name:
World Development Indicators
Source organization:
International Monetary Fund, Government Finance Statistics Yearbook and data files.
Categories, topics:
Public Sector
Last updated:
apr 23, 2017
Indicators value changes by year
At the date of observation
Value
Absolute change
Change from previous value
jan 1, 1995
2.334
+2.334
0.0%
jan 1, 2001
1.154
-1.179
-50.53%
jan 1, 2002
3.177
+2.022
175.18%
jan 1, 2003
3.913
+0.737
23.19%
jan 1, 2004
4.475
+0.562
14.35%
jan 1, 2005
4.913
+0.438
9.79%
jan 1, 2006
3.127
-1.786
-36.34%
jan 1, 2007
3.968
+0.84
26.86%
jan 1, 2008
2.601
-1.367
-34.45%
jan 1, 2009
3.867
+1.266
48.68%
jan 1, 2010
4.75
+0.883
22.83%
jan 1, 2011
4.875
+0.125
2.63%
jan 1, 2012
4.33
-0.545
-11.17%
jan 1, 2013
3.886
-0.444
-10.26%
jan 1, 2014
2.993
-0.893
-22.98%
Ranking of countries by current statistics by years


Comments: