29
/
en
AIzaSyAYiBZKx7MnpbEhh9jyipgxe19OcubqV5w
April 1, 2024
32892
Europe & Central Asia (IDA & IBRD countries)
TEC
false
2
1
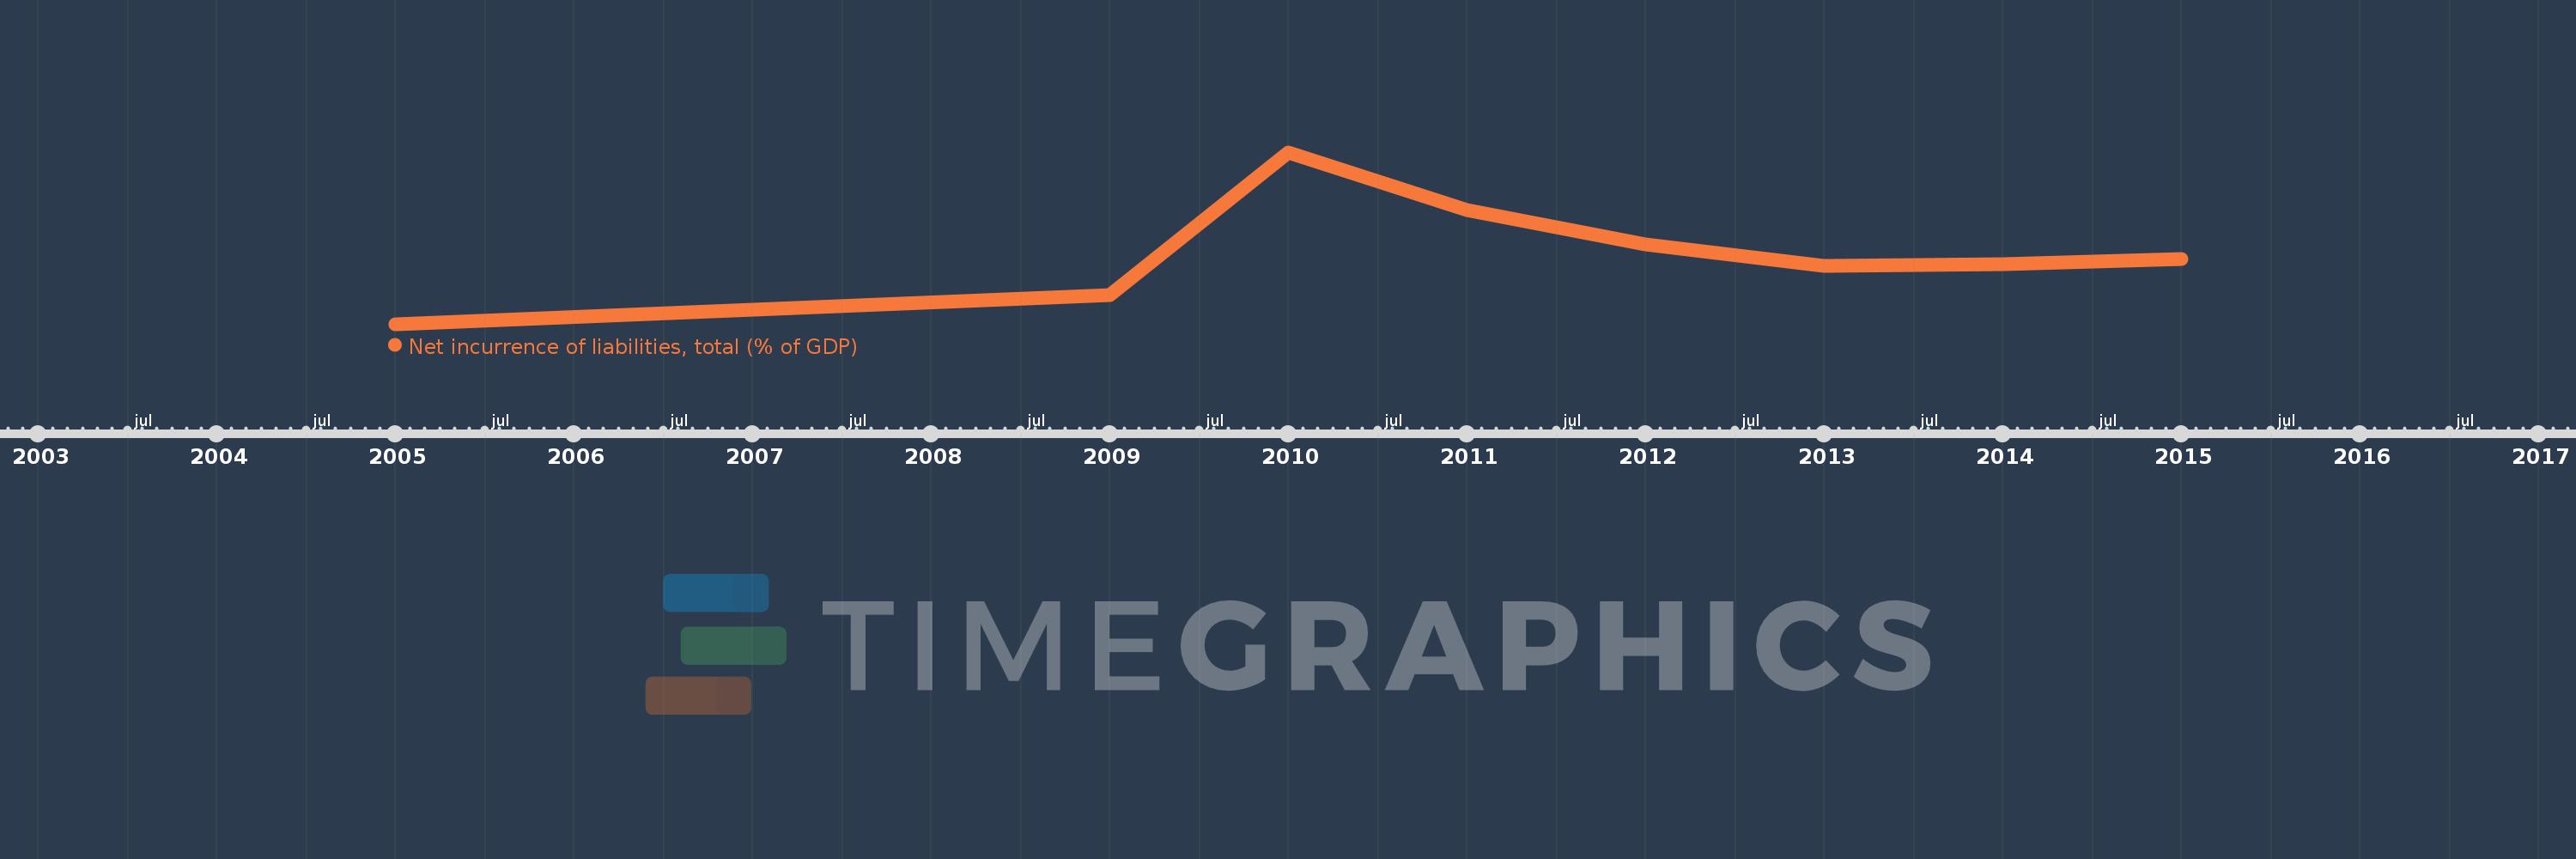
Net incurrence of liabilities, total (% of GDP)
2015,2014,2013,2012,2011,2010,2009,2005
This statistics in other country:
Timeline:
This timeline shows a graph from 2005 to 2015 of Europe & Central Asia (IDA & IBRD countries). No data until 2004. Number of actual observations by date: 8.
Source name:
World Development Indicators
Source organization:
International Monetary Fund, Government Finance Statistics Yearbook and data files.
Categories, topics:
Public Sector
Last updated:
apr 23, 2017
Indicators value changes by year
At the date of observation
Value
Absolute change
Change from previous value
jan 1, 2005
0.645
+0.645
0.0%
jan 1, 2009
1.262
+0.618
95.82%
jan 1, 2010
4.338
+3.076
243.67%
jan 1, 2011
3.095
-1.244
-28.66%
jan 1, 2012
2.363
-0.732
-23.64%
jan 1, 2013
1.896
-0.467
-19.75%
jan 1, 2014
1.933
+0.037
1.93%
jan 1, 2015
2.049
+0.116
6.0%
Ranking of countries by current statistics by years


Comments: