29
/
en
AIzaSyAYiBZKx7MnpbEhh9jyipgxe19OcubqV5w
April 1, 2024
80920
Belarus
BLR
true
2
1
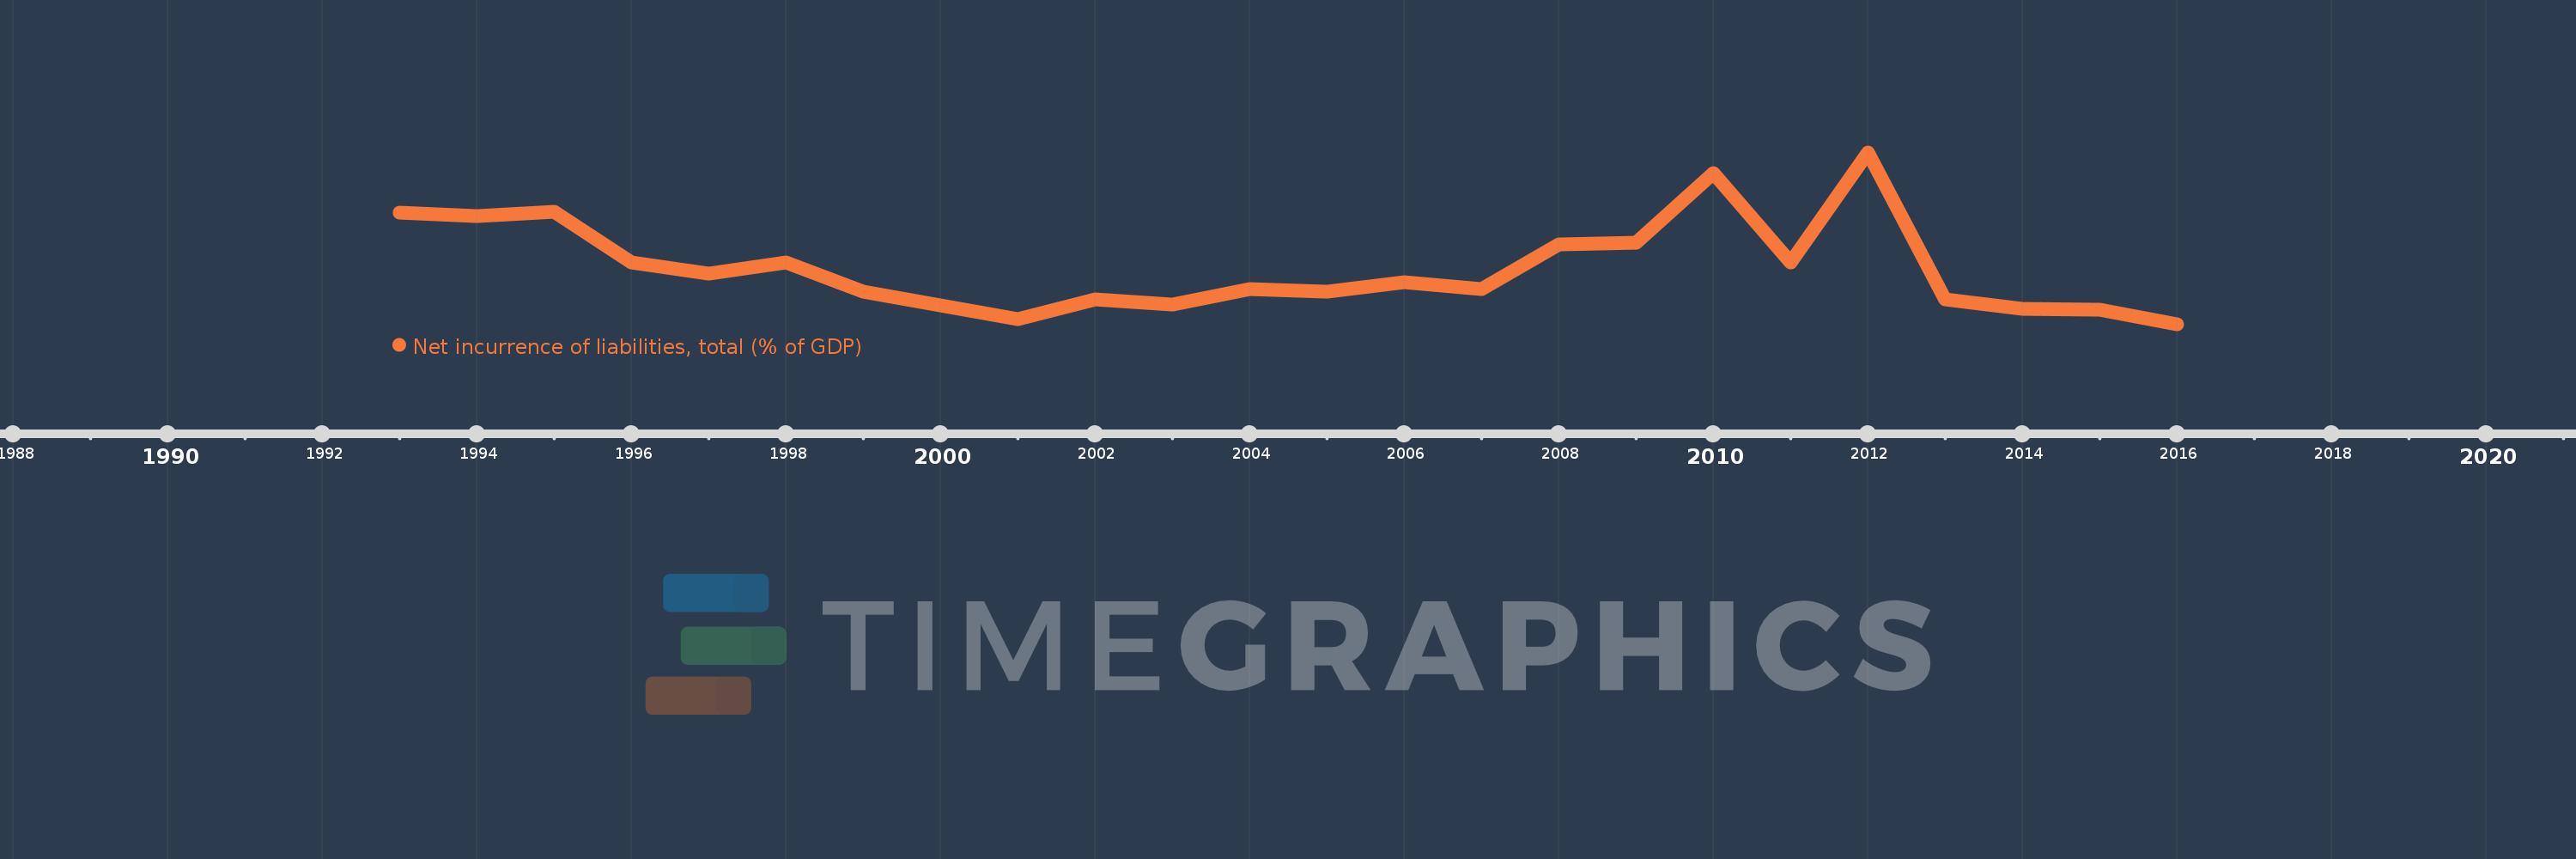
Net incurrence of liabilities, total (% of GDP)
2016,2015,2014,2013,2012,2011,2010,2009,2008,2007,2006,2005,2004,2003,2002,2001,2000,1999,1998,1997,1996,1995,1994,1993
This statistics in other country:
Timeline:
This timeline shows a graph from 1993 to 2016 of Belarus. No data until 1992. Number of actual observations by date: 24.
Source name:
World Development Indicators
Source organization:
International Monetary Fund, Government Finance Statistics Yearbook and data files.
Categories, topics:
Public Sector
Last updated:
apr 23, 2017
Indicators value changes by year
Minimum:
-0.503
jan 1, 2016
At the date of observation
Value
Absolute change
Change from previous value
jan 1, 1993
5.084
+5.084
0.0%
jan 1, 1994
4.912
-0.172
-3.38%
jan 1, 1995
5.115
+0.203
4.14%
jan 1, 1996
2.571
-2.545
-49.74%
jan 1, 1997
2.018
-0.553
-21.51%
jan 1, 1998
2.597
+0.579
28.71%
jan 1, 1999
1.144
-1.453
-55.95%
jan 1, 2000
0.446
-0.699
-61.05%
jan 1, 2001
-0.264
-0.71
-159.26%
jan 1, 2002
0.723
+0.987
-373.65%
jan 1, 2003
0.474
-0.248
-34.37%
jan 1, 2004
1.254
+0.78
164.36%
jan 1, 2005
1.118
-0.135
-10.81%
jan 1, 2006
1.606
+0.488
43.61%
jan 1, 2007
1.25
-0.356
-22.15%
jan 1, 2008
3.468
+2.217
177.33%
jan 1, 2009
3.583
+0.115
3.32%
jan 1, 2010
7.035
+3.452
96.36%
jan 1, 2011
2.571
-4.464
-63.45%
jan 1, 2012
8.079
+5.508
214.2%
jan 1, 2013
0.739
-7.34
-90.85%
jan 1, 2014
0.283
-0.456
-61.65%
jan 1, 2015
0.238
-0.046
-16.09%
jan 1, 2016
-0.503
-0.741
-311.58%
Ranking of countries by current statistics by years


Comments: