29
/
en
AIzaSyAYiBZKx7MnpbEhh9jyipgxe19OcubqV5w
April 1, 2024
199527
Mongolia
MNG
true
2
1
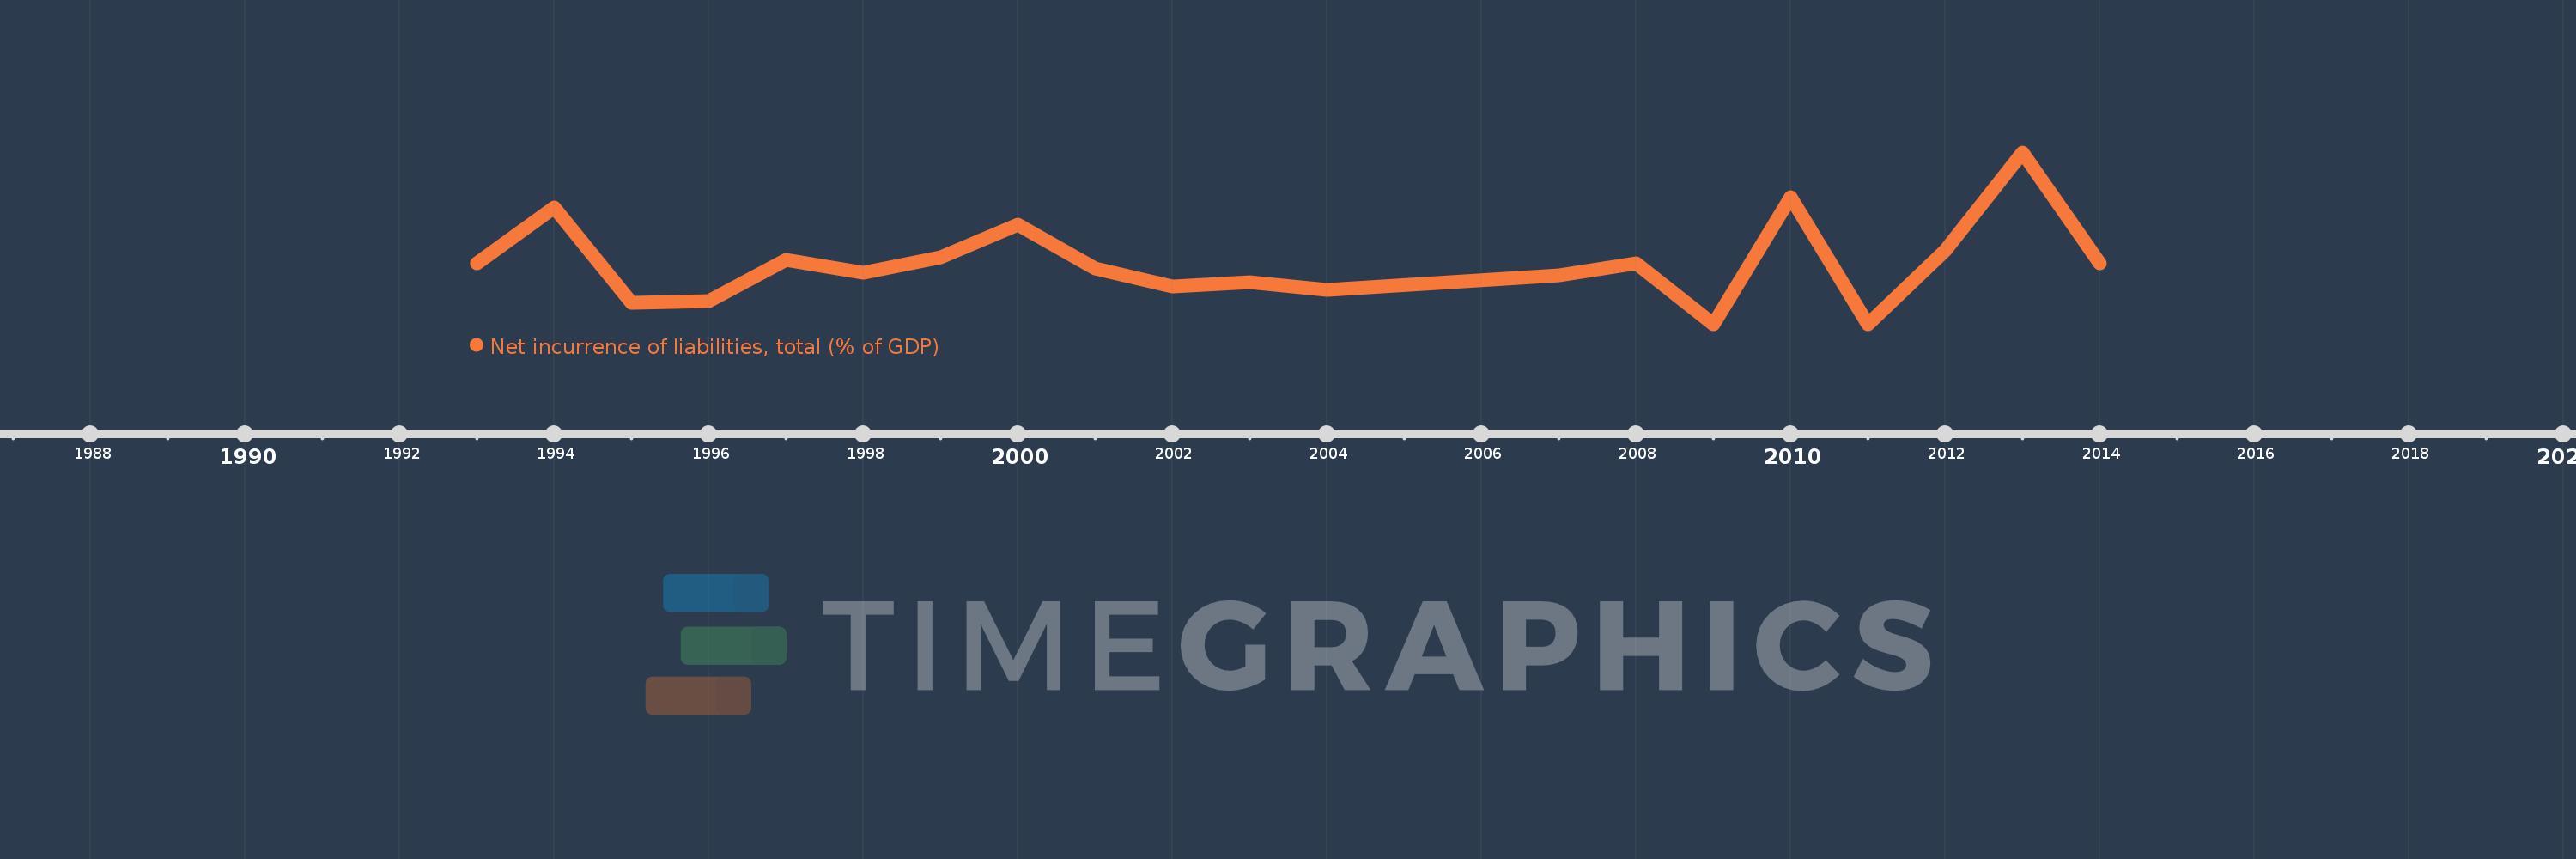
Net incurrence of liabilities, total (% of GDP)
2014,2013,2012,2011,2010,2009,2008,2007,2004,2003,2002,2001,2000,1999,1998,1997,1996,1995,1994,1993
This statistics in other country:
Timeline:
This timeline shows a graph from 1993 to 2014 of Mongolia. No data until 1992. Number of actual observations by date: 20.
Source name:
World Development Indicators
Source organization:
International Monetary Fund, Government Finance Statistics Yearbook and data files.
Categories, topics:
Public Sector
Last updated:
apr 23, 2017
Indicators value changes by year
Maximum:
16.979
jan 1, 2013
At the date of observation
Value
Absolute change
Change from previous value
jan 1, 1993
6.193
+6.193
0.0%
jan 1, 1994
11.626
+5.433
87.74%
jan 1, 1995
2.307
-9.319
-80.15%
jan 1, 1996
2.474
+0.167
7.25%
jan 1, 1997
6.502
+4.028
162.77%
jan 1, 1998
5.243
-1.259
-19.36%
jan 1, 1999
6.77
+1.527
29.13%
jan 1, 2000
9.906
+3.136
46.32%
jan 1, 2001
5.656
-4.251
-42.91%
jan 1, 2002
3.953
-1.703
-30.11%
jan 1, 2003
4.292
+0.339
8.58%
jan 1, 2004
3.561
-0.731
-17.03%
jan 1, 2007
5.032
+1.471
41.31%
jan 1, 2008
6.207
+1.175
23.35%
jan 1, 2009
0.256
-5.951
-95.87%
jan 1, 2010
12.641
+12.385
4.84K%
jan 1, 2011
0.239
-12.402
-98.11%
jan 1, 2012
7.395
+7.156
3.0K%
jan 1, 2013
16.979
+9.584
129.6%
jan 1, 2014
6.183
-10.796
-63.58%
Ranking of countries by current statistics by years


Comments: