29
/
en
AIzaSyAYiBZKx7MnpbEhh9jyipgxe19OcubqV5w
April 1, 2024
228871
Romania
ROU
true
2
1
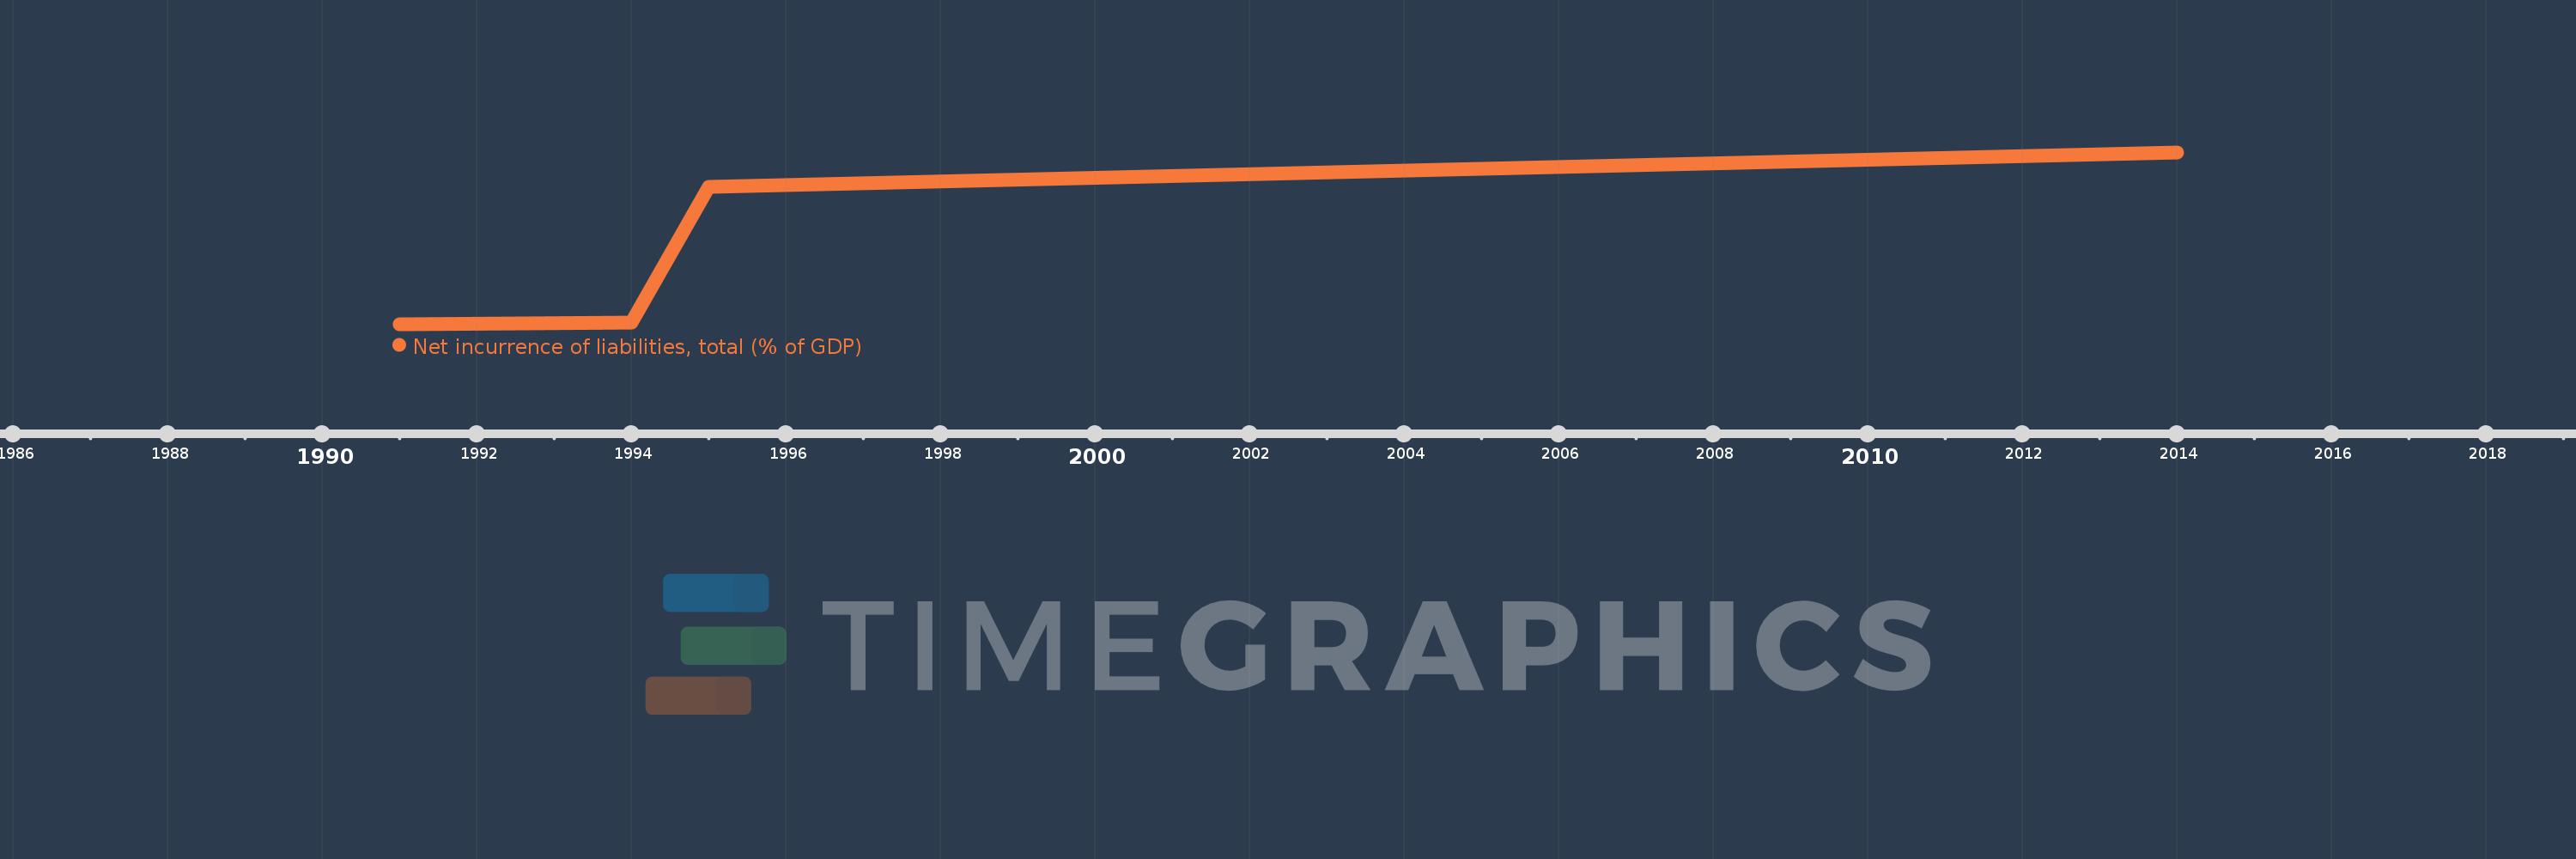
Net incurrence of liabilities, total (% of GDP)
2014,1995,1994,1991
This statistics in other country:
Timeline:
This timeline shows a graph from 1991 to 2014 of Romania. No data until 1990. Number of actual observations by date: 4.
Source name:
World Development Indicators
Source organization:
International Monetary Fund, Government Finance Statistics Yearbook and data files.
Categories, topics:
Public Sector
Last updated:
apr 23, 2017
Indicators value changes by year
At the date of observation
Value
Absolute change
Change from previous value
jan 1, 1991
0.443
+0.443
0.0%
jan 1, 1994
0.469
+0.026
5.77%
jan 1, 1995
2.508
+2.04
435.38%
jan 1, 2014
3.031
+0.523
20.85%
Ranking of countries by current statistics by years


Comments: