29
/
en
AIzaSyAYiBZKx7MnpbEhh9jyipgxe19OcubqV5w
April 1, 2024
52095
North America
NAC
false
2
1
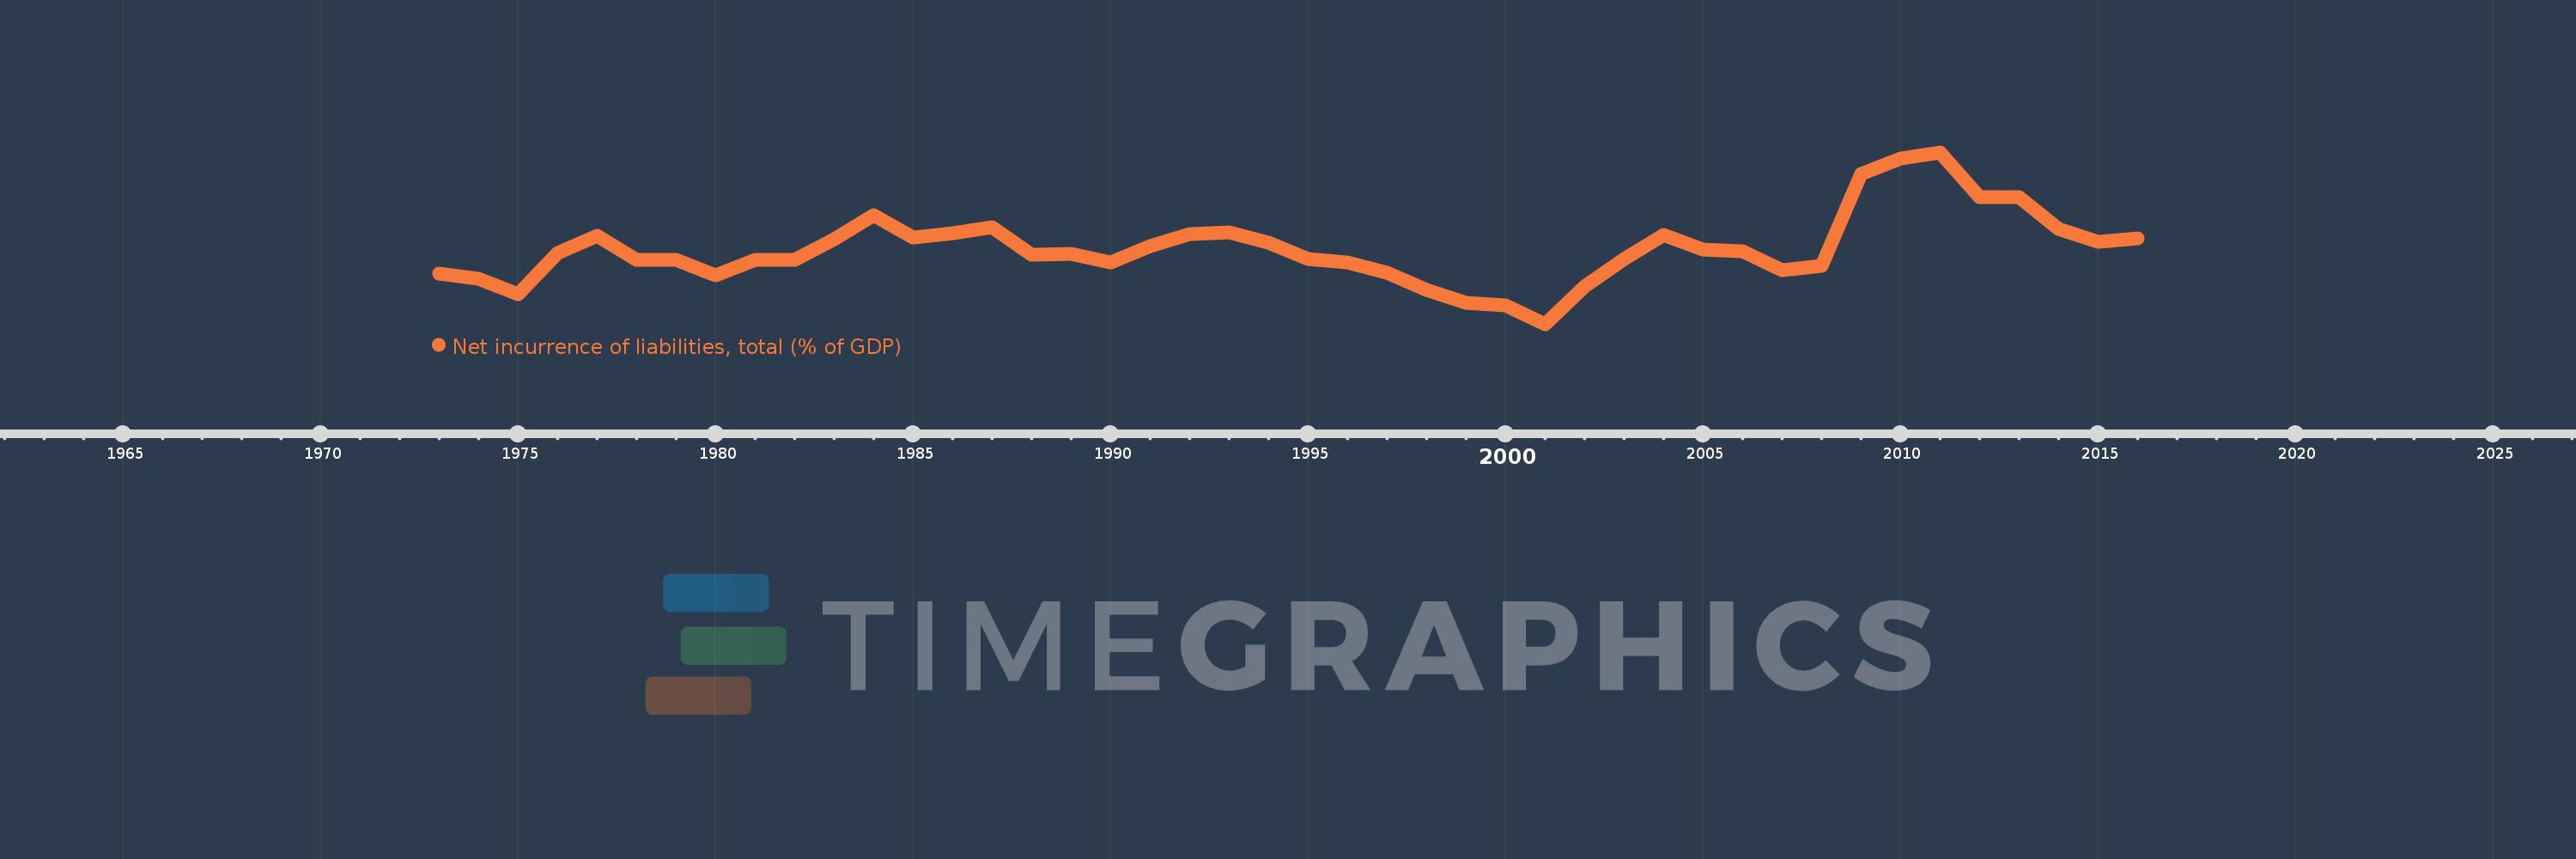
Net incurrence of liabilities, total (% of GDP)
2016,2015,2014,2013,2012,2011,2010,2009,2008,2007,2006,2005,2004,2003,2002,2001,2000,1999,1998,1997,1996,1995,1994,1993,1992,1991,1990,1989,1988,1987,1986,1985,1984,1983,1982,1981,1980,1979,1978,1977,1976,1975,1974,1973
This statistics in other country:
Timeline:
This timeline shows a graph from 1973 to 2016 of North America. No data until 1972. Number of actual observations by date: 44.
Source name:
World Development Indicators
Source organization:
International Monetary Fund, Government Finance Statistics Yearbook and data files.
Categories, topics:
Public Sector
Last updated:
apr 23, 2017
Indicators value changes by year
Minimum:
-2.105
jan 1, 2001
Maximum:
10.602
jan 1, 2011
At the date of observation
Value
Absolute change
Change from previous value
jan 1, 1973
1.61
+1.61
0.0%
jan 1, 1974
1.26
-0.35
-21.75%
jan 1, 1975
0.131
-1.129
-89.6%
jan 1, 1976
3.143
+3.012
2.3K%
jan 1, 1977
4.409
+1.266
40.27%
jan 1, 1978
2.676
-1.733
-39.3%
jan 1, 1979
2.631
-0.046
-1.72%
jan 1, 1980
1.513
-1.118
-42.49%
jan 1, 1981
2.676
+1.163
76.91%
jan 1, 1982
2.641
-0.035
-1.32%
jan 1, 1983
4.148
+1.507
57.08%
jan 1, 1984
5.926
+1.778
42.85%
jan 1, 1985
4.308
-1.618
-27.3%
jan 1, 1986
4.614
+0.305
7.09%
jan 1, 1987
5.077
+0.464
10.05%
jan 1, 1988
3.05
-2.027
-39.92%
jan 1, 1989
3.073
+0.023
0.75%
jan 1, 1990
2.466
-0.607
-19.77%
jan 1, 1991
3.683
+1.217
49.36%
jan 1, 1992
4.59
+0.907
24.63%
jan 1, 1993
4.674
+0.084
1.83%
jan 1, 1994
3.901
-0.773
-16.54%
jan 1, 1995
2.731
-1.17
-30.0%
jan 1, 1996
2.437
-0.293
-10.74%
jan 1, 1997
1.694
-0.743
-30.49%
jan 1, 1998
0.416
-1.279
-75.47%
jan 1, 1999
-0.55
-0.965
-232.24%
jan 1, 2000
-0.723
-0.173
31.57%
jan 1, 2001
-2.105
-1.382
191.22%
jan 1, 2002
0.689
+2.794
-132.72%
jan 1, 2003
2.702
+2.013
292.19%
jan 1, 2004
4.49
+1.789
66.21%
jan 1, 2005
3.427
-1.063
-23.68%
jan 1, 2006
3.298
-0.129
-3.76%
jan 1, 2007
1.897
-1.401
-42.47%
jan 1, 2008
2.231
+0.334
17.62%
jan 1, 2009
8.979
+6.748
302.39%
jan 1, 2010
10.166
+1.187
13.22%
jan 1, 2011
10.602
+0.436
4.29%
jan 1, 2012
7.267
-3.335
-31.46%
jan 1, 2013
7.315
+0.048
0.66%
jan 1, 2014
4.913
-2.402
-32.84%
jan 1, 2015
3.981
-0.931
-18.96%
jan 1, 2016
4.225
+0.243
6.11%
Ranking of countries by current statistics by years


Comments: