Download This statistics in other country:
Timeline:
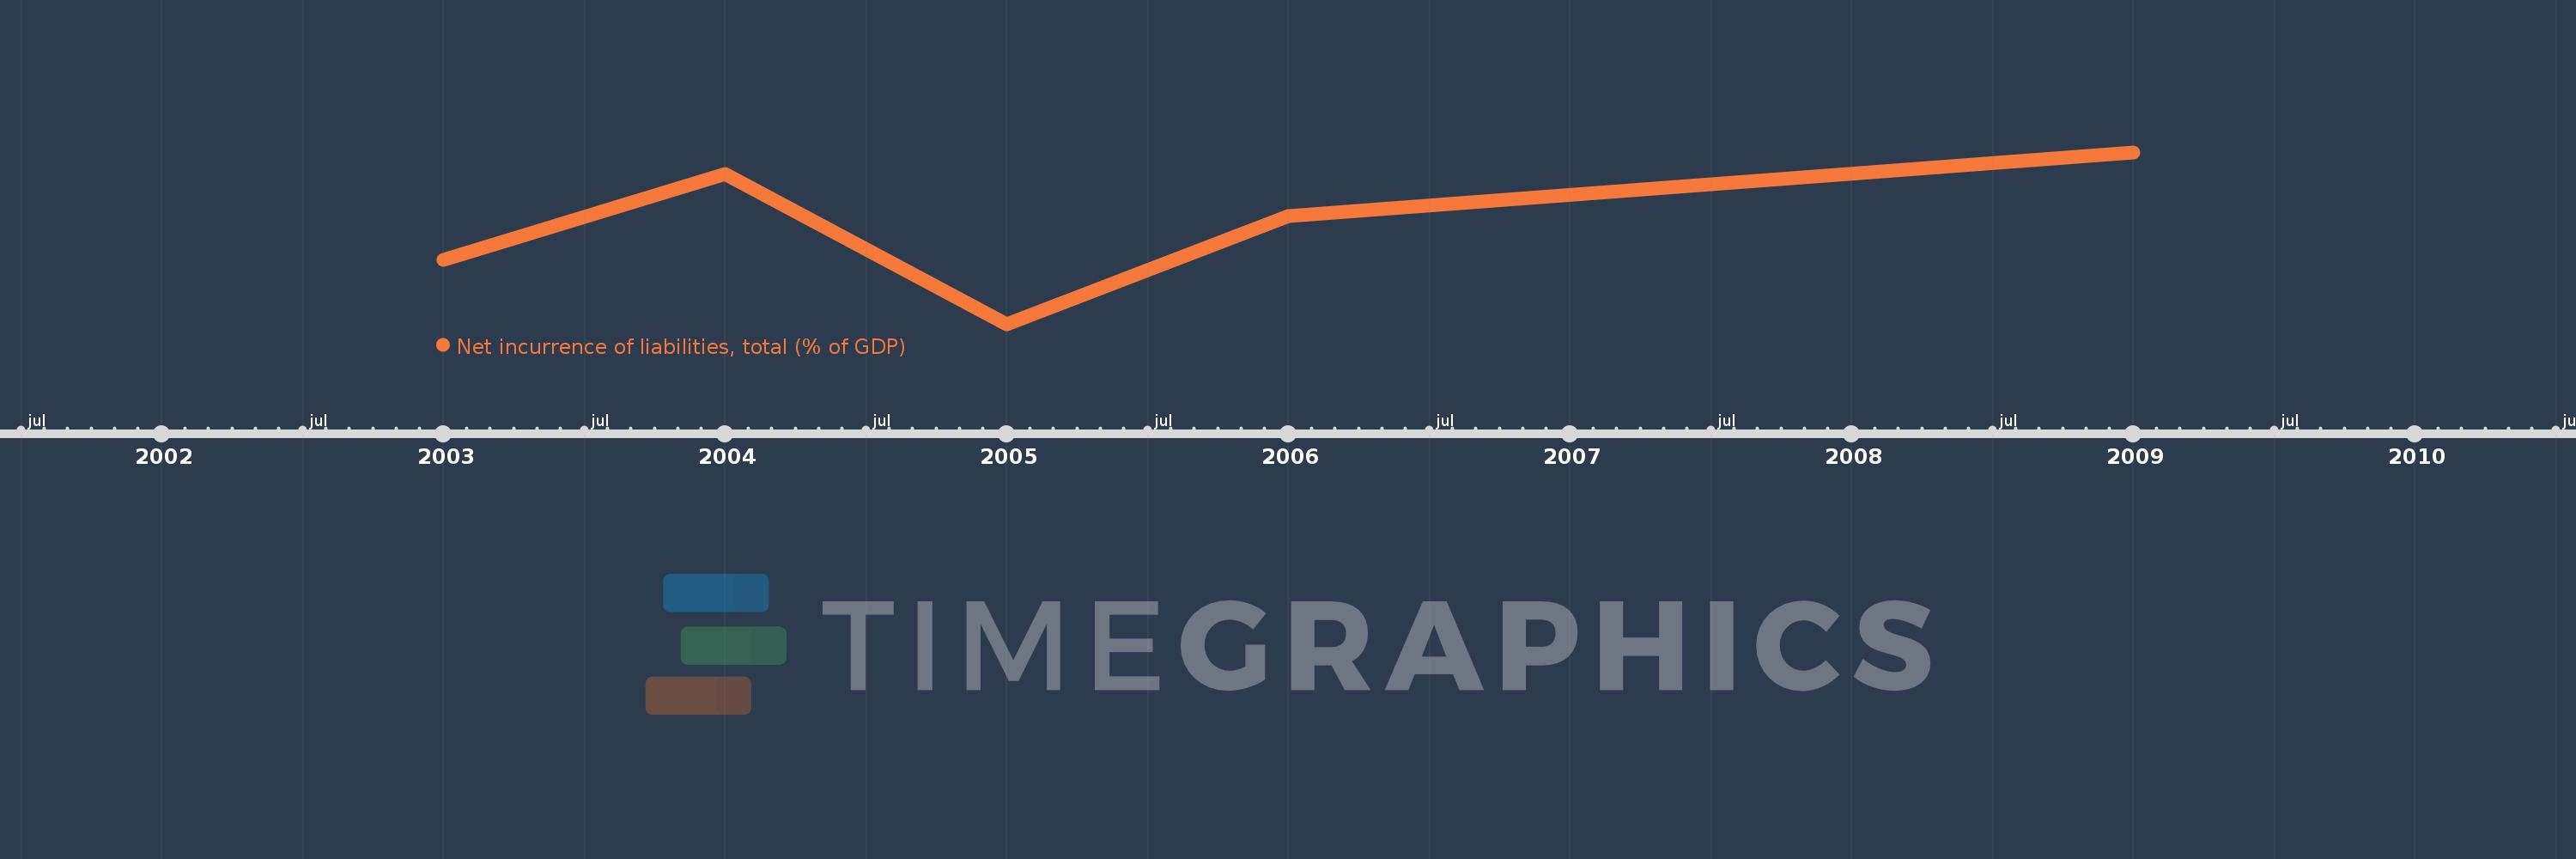
This timeline shows a graph from 2003 to 2009 of New Zealand. No data until 2002. Number of actual observations by date: 5.
Source name:
World Development Indicators
Source organization:
International Monetary Fund, Government Finance Statistics Yearbook and data files.
Categories, topics:
Public Sector
Last updated:
apr 23, 2017
Indicators value changes by year
Minimum:
-0.608
jan 1, 2005
At the date of observation
Value
Absolute change
Change from the previous value
jan 1, 2003
0.368
+0.368
0.0%
jan 1, 2004
1.658
+1.29
350.71%
jan 1, 2005
-0.608
-2.266
-136.68%
jan 1, 2006
1.023
+1.631
-268.2%
jan 1, 2009
1.982
+0.959
93.75%
Ranking of countries by current statistics by years
